3.3 Career options for students in Natural sciences and Engineering
ポイント
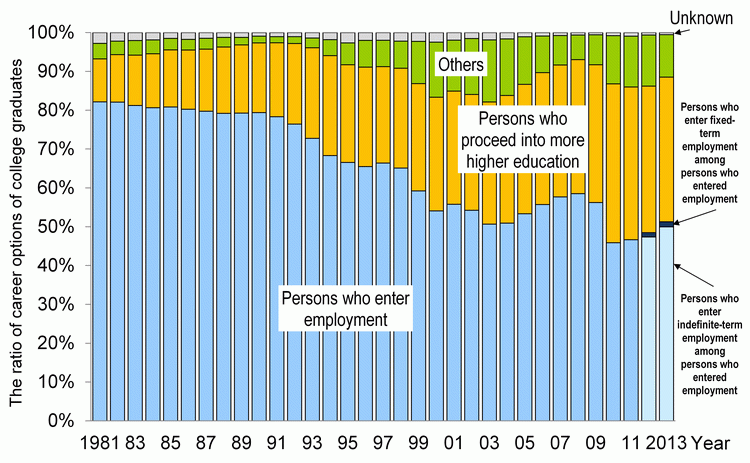
- Looking at the career paths of undergraduate students in “natural sciences and engineering” after graduating, in FY 2013 the share of “persons who entered employment” was the largest at 51.3%. It was followed by “persons who proceeded with higher education” at 37.3%. It should be noted that 97.4% of “persons who entered employment” were “persons who entered indefinite-term employment” as regular employees.
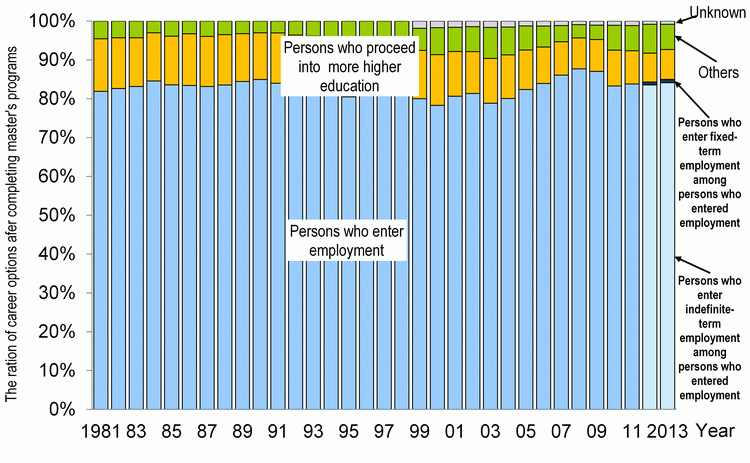
- Looking at the career paths of master's course students in “natural sciences and engineering” after graduation, in FY 2013 “persons who entered employment” accounted for 85.0% of the total. Of “persons who entered employment,” 99.0% were “persons who entered indefinite-term employment.”
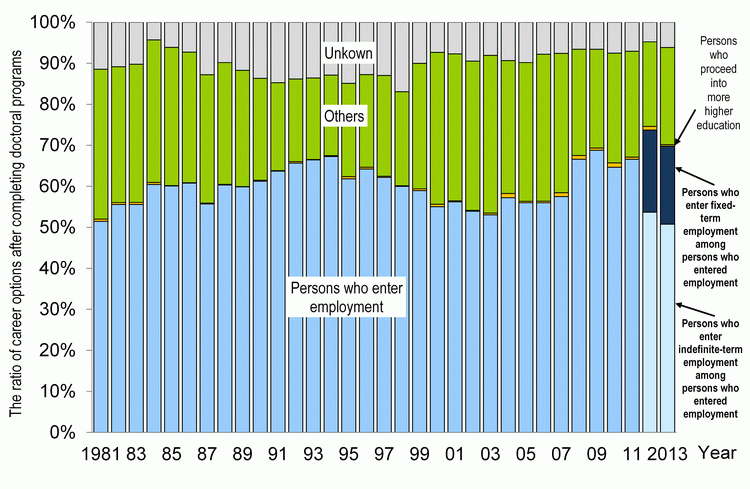
- Looking at the career paths of master's course students in “natural sciences and engineering” after graduation, in FY 2013 “persons who entered employment” accounted for 69.8% of the total. However, 72.7% of “persons who entered employment” were “persons who entered indefinite-term employment,” which is a slightly low figure when compared to the “persons who entered indefinite-term employment” figures for undergraduate course graduates and master's course graduates.
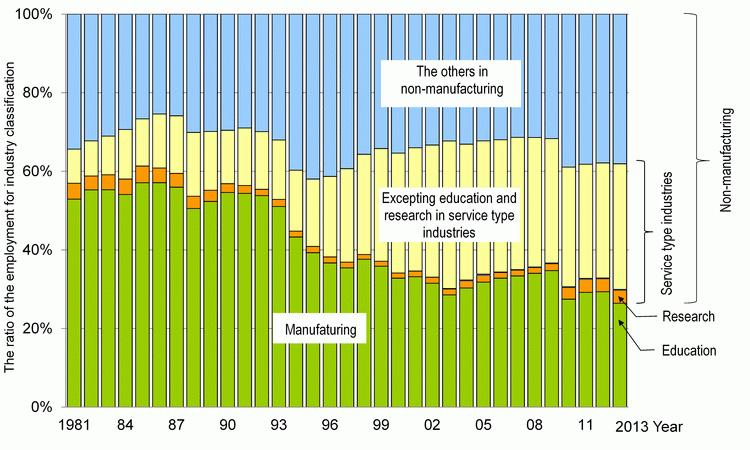
- Looking at the industrial classifications in which graduates receiving bachelor's degrees in natural sciences and engineering obtained employment, over 50% of those obtaining employment during the 1980s went to work in a manufacturing industry. In recent years, however, that percentage fell into the 30% bracket, and in 2013 it was only 26.4%.
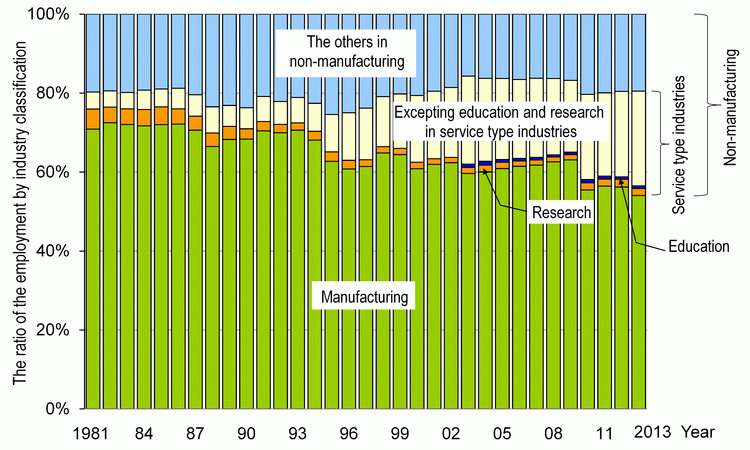
- In the case of students obtaining master's degrees in natural sciences and engineering, the percentage obtaining employment in “manufacturing” was at the 70% level in the 1980s; however, this figure fell to the 60% level from the mid-1990s and stood at 54.1% in 2013. The percentage obtaining employment in education (employed at schools, etc.) has been falling from the 4% level and reached 1.8% in 2013.
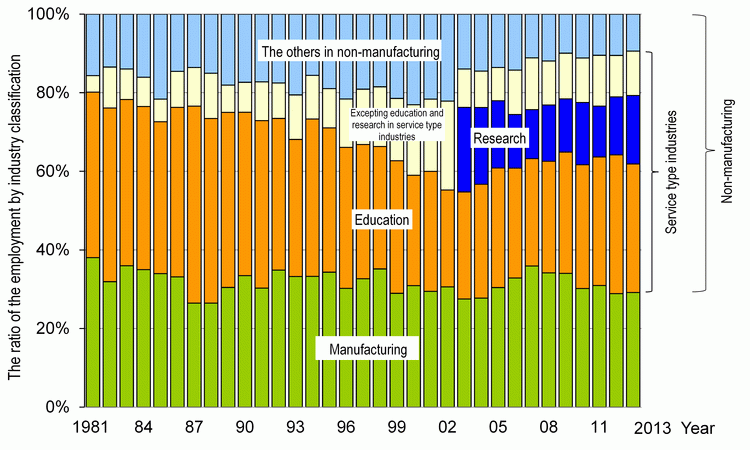
- About 30% of those obtaining doctoral degrees in natural sciences and engineering have been obtaining employment in manufacturing industries. In 2013, the figure was 29.2%. For those obtaining employment in “education (persons obtaining employment in schools, etc.),” this figure had reached as high as 50% in the mid-1980s but fell to under 30% entering the 2000s. It stood at 32.7% in 2013. The figure for “research (persons obtaining employment in academic or R&D institutions, etc.) was 17.4% in 2013.
- Looking at graduates of undergraduate, master's, and doctoral courses in “Natural sciences and engineering” who entered employment by industrial classification, many become “persons who engage in specialized and technical work.” In the case of those with master's or doctoral degrees, they have accounted for almost 90% of those obtaining employment. For those with bachelor's degrees, the long-term trend has been downwards. In recent years, their percentage has been in the 70s.
- A breakdown of “persons who engage in specialized and technical work” shows that while almost all graduates of undergraduate or master's courses are “engineers,” many of those who are graduates of doctoral courses are also “researchers” or “teachers.”
3.3.1 The status of employment and continuing education among students of Natural sciences and Engineering
This section describes career options particularly for students of “Natural sciences” and “Engineering” . “Persons who enter employment” as used herein represents those who get jobs with routine income. Persons who get temporary or part time jobs are included in “Others” . Moreover, beginning in 2012, “persons who entered employment” are being classified into “persons who enter indefinite-term employment” and “persons who enter fixed-term employment.” Here, “person who enters indefinite-term employment” refers to a person who obtains employment for a period that is not determined, while “fixed-term employment” refers to a person who obtains employment with a set employment period of at least one year and with prescribed working hours of 30 to 40 hours per week. These data was based on a survey of the employment status of students for whom universities and colleges could provide information at the time of the survey being conducted (as of May 1st of respective years).
(1) Career options of college graduates
Looking at the career options of “natural sciences and engineering” college graduates for FY 2013 (Chart 3-3-1), “persons who entered employment” had the largest share at 51.3%, followed by “persons who proceeded with higher education” with 37.3%. The percentage of “persons who entered employment” was approximately 80% in the 1980s, however, it largely declined in the 1990s. This percentage had been rising since the early 2000s but fell significantly in 2010. Since then it has been rising again. It deserves noting that “persons who entered indefinite-term employment” account for 97.4% of “persons who entered employment,” and that almost all of these are employed as regular employees.
On the other hand, the percentage of people proceeding to higher education had been trending upward, possibly due in part to the influence of expanded graduate schools from the late 1990s. However, this percentage has been decreasing since peaking in 2010.
Note:
1) Chart indicates the number of people graduating in March of each year.
2) This chart includes both “persons who entered employment” and “persons who proceeded with more higher education” in the “number of persons who entered employment” .
3) Persons who entered employment are persons who work for current income
4) Person who enters indefinite-term employment: A person who obtains employment for a period that is not determined or limited
5) Person who enters fixed-term employment: A person who obtains employment with a set employment period of at least one year and with prescribed working hours of around 30 to 40 hours per week
6) Person who proceeded with higher education: A person who advances to a university, etc. Excludes people who enroll in a special vocational school, school in a foreign country, etc.
7) Unclear: Deceased/Unknown
8) The others: Do not fall under above mentioned
Source:
MEXT, “Report on School Basic Survey”
(2) Career options of persons who complete master's programs
Looking at career options of persons who complete master's programs in “Natural sciences and Engineering” over the long term, the composition ratio did not show a big change until the early 2000s and the percentage of “persons who entered employment” accounted for about 80% of the total. The percentage continued increasing from the beginning of the 2000s but decreased slightly in 2010. Since then it has remained mostly unchanged and stood at 85.0% in 2013. In addition, “persons who enter indefinite-term employment” accounted for 99.0% of “persons who entered employment” ; almost all of these are employed as regular employees.
The percentage of “persons who proceeded with higher education” had been decreasing from the early 2000s, but increased slightly in 2010 before leveling out; it was relatively unchanged at 7.7% in 2013 (Chart 3-3-2).
Note:
Same as Chart 3-3-1
Source:
MEXT, “Report on School Basic Survey”
(3) Career options of people who complete doctoral programs
Looking at the career paths of doctoral course students in “natural sciences and engineering” after graduation (Chart 3-3-3), the percentage of “persons who entered employment” had been decreasing significantly from the mid-1990s until around 2000, but has been increasing ever since. In 2013, the percentage of “persons who entered employment” stood at 69.8%. However, 72.7% of “persons who entered employment” were “persons who entered indefinite-term employment,” which is a slightly low figure when compared to the “persons who entered indefinite-term employment” figures for undergraduate course graduates and master's course graduates. It is thought that the figure for “persons who enter fixed-term employment” among graduates of doctoral courses includes postdocs and fixed-term researchers.
Furthermore, while the percentages for “others” are large when compared to undergraduate and master's course graduates, they have been falling since 2000.
Note:
Same as for Chart 3-3-1.
Sources:
MEXT, “School Basic Survey.”
Chart 3-3-3 shows “postdoctoral career options in natural sciences and engineering.” The percentage of “other” is higher than it is for those completing bachelor's or master's degrees. Other as used here refers to the sum of “medical residents,” “persons enrolled in special course schools and schools abroad,” “persons with temporary jobs” and “Not applicable” in the School Basic Survey. The following are two probable reasons that the percentage of “Other” is high.
One factor is the effect of career path classifications for postdoctoral fellows. It is unclear whether the School Basic Survey classifies postdoctoral fellows as “persons obtaining employment,” “persons obtaining temporary work” or “Not applicable.” The employment patterns of postdoctoral fellows are diverse; in some cases, they are employed for terms of a few months at a time. They might therefore be classified as “persons obtaining temporary work” or “Not applicable.”
The second reason is probably the effect of graduates with undetermined career paths at the time of the survey. Unlike graduates with bachelor's and master's degrees, most doctoral graduates aim for academic careers. Hiring by businesses in Japan generally takes place during a set period each year. Hiring for academic posts, however, occurs throughout the year. Many doctoral graduates seeking academic careers may therefore have not yet established their career paths as of May 1 of the year following graduation when the School Basic Survey is performed. Having neither obtained employment nor proceeded to further education, those people would likely be classified as “Not applicable.” In actuality, in FY 2013, the percentage of “not applicable persons” in “others” (1,185 persons) was the largest at approximately 70%. Moreover, it is possible that a certain number of people exist whose employment status could not be determined by their schools, as they did not give a response in the employment status survey because their status had yet to be determined at that time (such people are considered “unknown” ).
From the above, it can be concluded that the high percentage of “others” among graduates of doctoral courses in the field of natural sciences and engineering comes from the fact that their career paths differ from those of undergraduate and master's course graduates.
In order to obtain more detailed information, it would be necessary to conduct ongoing follow-up surveys to analyze which occupations and industries human resources with doctoral degrees work in, as is done in the U.S.
3.3.2 The employment status of students of Natural sciences and Engineering by industry classification
This section shows the place of employment by industry classification of the students described in section 3.3.1, “The status of employment and continuing education among students of Natural sciences and Engineering” . The industry classification used herein is the “Japan Standard Industry Classification: JSIC” which determines an industry by the main services of its business enterprises (The revision of JSIC was conducted in 1993, 2002 and 2007 and all were applied from the next year). Education as used in the JSIC refers to “school education,” which includes elementary schools, junior high schools, high schools, universities and colleges. And “Research” means “Academic and R&D institutes” , which refers to business premises doing academic, experimental and R&D research.
(1) College graduates entering employment
Looking by industry classification at changes in the percentage of bachelor's degree recipients in “natural science and engineering” who entered employment (Chart 3-3-4), the percentage of employment in “manufacturing” was at the 50% level during the 1980s but has been falling down to the 30% level since the mid-1990s. In 2013 it fell to 26.4%. Meanwhile, the percentage of employment in “service-type industry” within “non-manufacturing” increased from the 10% level to the 30% level. Of this, “education” fell from the 4% level in the early 1980s to the 1% level in the 1990s. “Education” had remained at the 1% level partly due to the separate measurement of “research,” but rose to the 3% level in recent years; it stood at 3.3% in 2013. Additionally, the percentage in “other non-manufacturing” grew large beginning in 2010.
(employment status by industry classification)
Note:
1) Includes both “persons who entered employment” and “persons who proceeded with more higher education” in the “number of persons who entered employment” .
2) 1981-2001
Service-type industry: “Service industry” in Japan Standard Industry Classification (1993 revision)
Education/research: In Japan Standard Industry Classification (1993 revision), “Education” within “Service industries.”
2002-2006
Service-type industry: In Japan Standard Industry Classifications (revised in 2002), “Information and communication industry” , “Catering establishment, Service industry” , “Medical services, Welfare” , “Education, Study-support service” excludes “School education” : “Combined services” , “unclassified other services” excepting “Academic field/R&D”
Education/research: “School education” within “Education, Study-support services” and “Academic field/R&D” within “Unclassified other services”
2007 -
Service-type industry: In Japan Standard Industry Classifications (revised in 2007), refers to “Academic research, Specialty services” excluding “Academic field/R & D institutions” : “Lodging industry, Catering establishment” , “Living-related services” and “Education, Study-support services” without “School education” : “Medical services, Welfare” , “Combined services” , “unclassified other services” and “Information and communication services”
Education/research: In Japan Standard Industry Classification (2007 revision), “academic field/R&D institutions” within “academic research, specialty services” and ““school education” within “education, study-support services”
Source:
MEXT, “Report on School Basic Survey”
(2) Master's degree program graduates entering employment
Looking by industry classification at changes in the percentage of graduates from master's degree programs in “natural sciences and engineering” that entered employment, the percentage finding employment in “manufacturing” was around the 70% level during the 1980s. This percentage fell to around 60% from the mid-1990s and has been decreasing since then. In 2013 it stood at 54.1%. Meanwhile, the percentage of employment in “service-type industry” within “non-manufacturing” is on a continuous upward trend. The share of “education” within this category has been falling from the 4% level; it stood at 1.8% in 2013. And “Research” is under 1% (Chart 3-3-5).
Note:
Same as for Chart 3-3-4.
Source:
MEXT, “Report on School Basic Survey”
(3) Doctoral graduates entering employment
Looking by industry classification at changes in the percentage of doctoral graduates in “natural sciences and engineering” who enter employment, although there are year-to-year fluctuations, the percentage obtaining employment in “manufacturing” has generally been around 30%. In 2013, it was 29.2%. The percentage obtaining employment in “non-manufacturing” was higher than this throughout all periods. Within “non-manufacturing,” the percentage in “service-type industry” began increasing during the 2000s. In 2013, it was 61.4%. Regarding “education” among “service-type industry,” this percentage reached as high as 50% in the mid-1980s but fell to under 30% upon entering the 2000s. It stood at 32.7% in 2013. The percentage of doctoral graduates finding employment in “research,” which has been measured since 2003, has been large compared with those of graduates receiving bachelor's and master's degrees. In 2013, it was 17.4% (Chart 3-3-6).
(employment status by industry classification)
Note:
Same as for Chart 3-3-4.
Source:
MEXT, “Report on School Basic Survey”
3.3.3 The employment status of Natural sciences and Engineering students
This section shows the place of employment by occupation classification of the students described in section 3.3.1, “The status of employment and education continuance on Natural sciences and Engineering students” . Occupation classification referred to herein means the “Japan Standard Occupational Classification” and it classifies individual occupations. Therefore, it is without regard for the business activities of Business enterprises which individuals belong to.
“Researchers” as used herein means “persons who engage in research requiring specialized and scientific knowledge for research and testing in facilities such as laboratories and test stations.” “Engineers” mean “persons who engage in scientific and technical work which applies specialized, scientific knowledge and means for production such as project management, supervision and research.” “Teachers” are “persons who engage in education and advocacy for students in facilities which provide education such as schools and kindred class of school education” . Teachers at universities and colleges are included in this category.
(1) College graduates entering employment
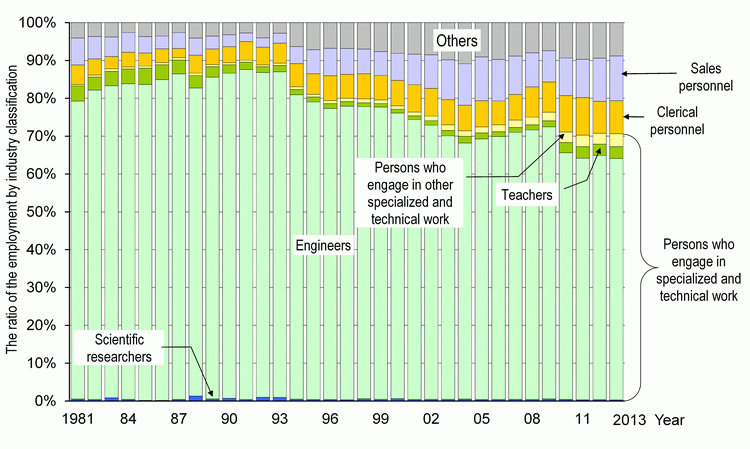
Looking by occupation classification at the employment percentage of “natural sciences and engineering” college graduates, “persons who engage in specialized and technical work” was at 80-90% during the 1990s and dropped to the 70s during the 2000s. Breaking this down further, “engineers” have accounted for a large percentage, but this has been declining over the long term. In 2013, they accounted for 63.8%. The percentage of “persons who engage in clerical work” and “sales personnel,” on the other hand, has been increasing (Chart 3-3-7).
Note:
Following a 2011 revision of classifications, researchers are now called “Researchers” rather than “Scientific researchers.”
Source:
MEXT, “Report on School Basic Survey”
(2) Master's degree program graduates entering employment
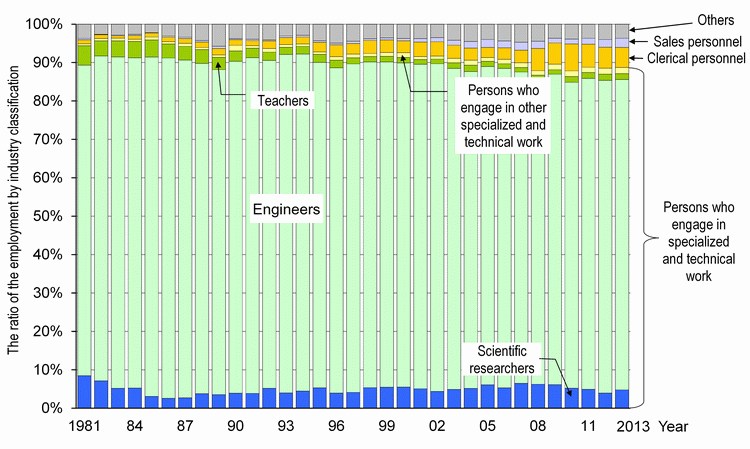
Looking at the employment percentage of persons who completed master's program in Natural sciences and Engineering by occupation classification, “persons who engage in specialized and technical work” is approximately 90% of the total and consistently accounts for the large portion. Breaking this down further, “engineers” account for a large percentage, accounting for about 80% of the total. “Researchers” have been trending at around 5 to 6% in recent years. The percentage of “teachers” has been decreasing in the long term, hovering at the 1% level during recent years. On the other hand, “persons who engage in clerical work” has continued to increase slightly (Chart 3-3-8).
in Natural sciences and Engineering by occupation
Note:
Following a 2011 revision of classifications, researchers are now called “Researchers” rather than “Scientific researchers.”
Source:
MEXT, “Report on School Basic Survey”
(3) Doctoral graduates entering employment
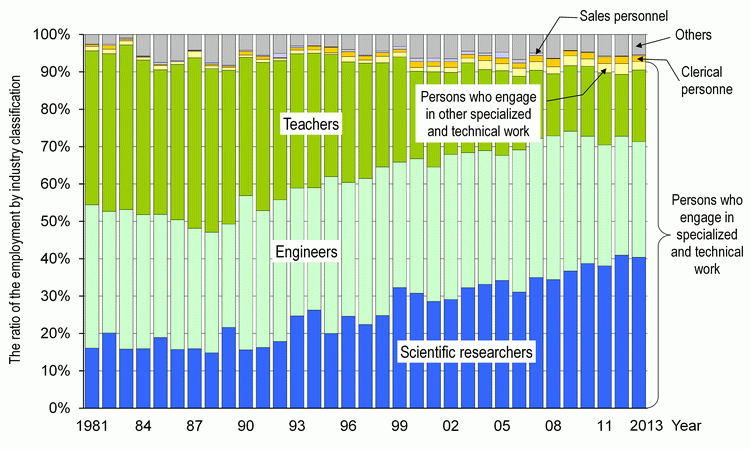
Looking at the employment percentage of doctoral graduates in Natural sciences and Engineering by occupation classification, “persons who engage in specialized and technical work” comprise a high level of over 90%. Breaking this down further, “engineers” account for about 30 to 40% of the total. On the other hand, the percentage of “researchers” was less than 20% but began to increase around 2000. In recent years it has risen to around 40%, thereby surpassing “engineers.” Conversely, the percentage of “teachers,” which had been at around 40%, has been decreasing, falling to below 20% in recent years (Chart 3-3-9).
Note:
Following a 2011 revision of classifications, researchers are now called “Researchers” rather than “Scientific researchers.”
Source:
MEXT, “Report on School Basic Survey”

