3.4 International comparison of degree holders
Key points
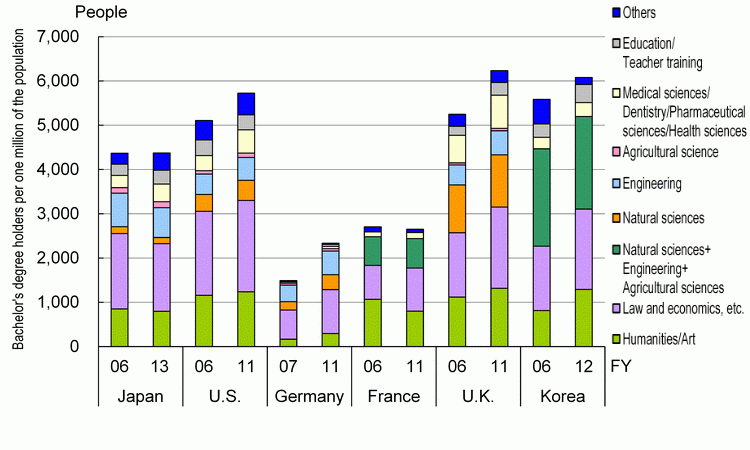
- Looking at numbers of persons who acquired bachelor's degrees per one million population, Japan stood at 4,373 in FY 2013. The countries with the largest numbers for the most recent available year were the U.K. followed by Korea; both exceeded 6,000.
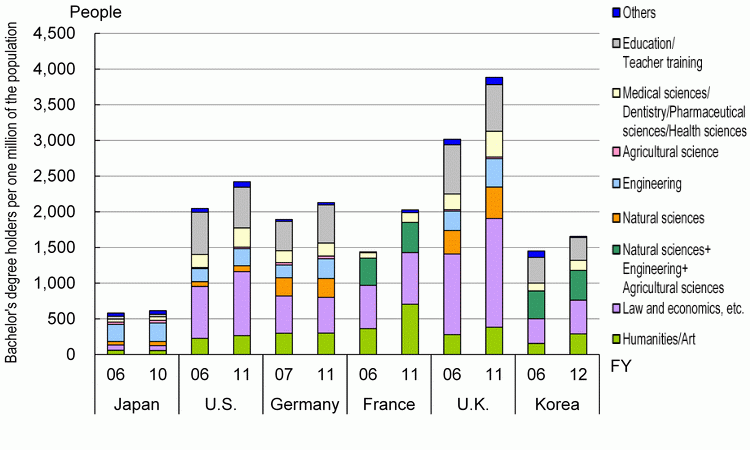
- Looking at the number of persons who acquired master's degrees per one million population in each country, Japan had an extremely small number with 615 in FY 2010. In terms of figures for the most recent available year in the surveyed countries, the U.K. was far ahead of the others with 3,884.
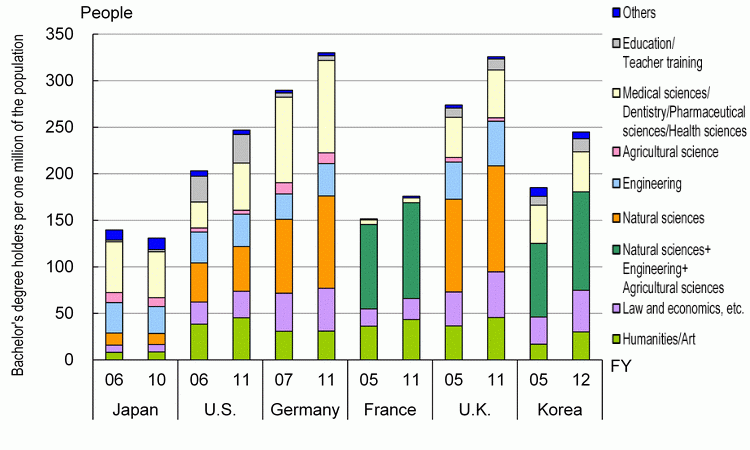
- Looking at the number of persons who acquired doctoral degrees per one million population in each country, Japan had 131 (FY 2010), which was small in comparison with the other countries. The countries with the largest number for the most recent available year were Germany followed by the U.K.; both exceeded 300.
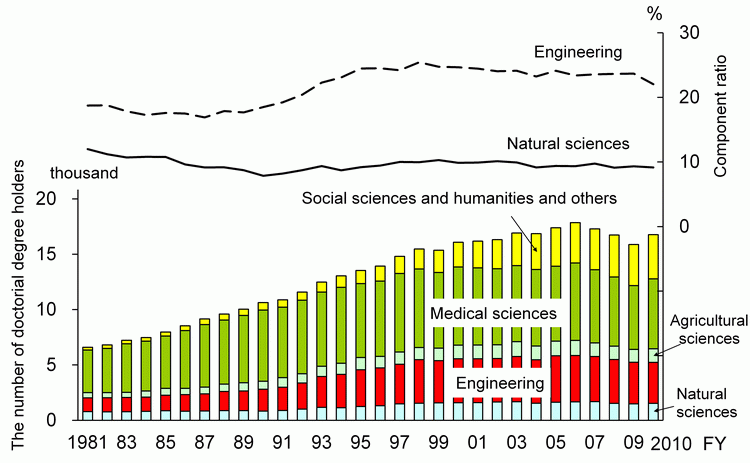
- Looking at the number of persons who acquired doctoral degrees in Japan in FY 2010 by major field of study, medical sciences (medicine, dentistry, pharmacy, and health care) had the highest share with 6,315, or 37.7% of the total. Following were engineering, which accounted for 3,693 (22.0%), and natural sciences, which accounted for 1,534 (9.2%).
3.4.1 International comparison of the number of bachelor's degrees, master's degrees and doctorates degrees awarded
This section looks at the numbers of bachelor's, master's, and doctoral degrees awarded per 100 million of population in each of the surveyed countries. Here, the number of persons awarded degrees is calculated as the number of people who newly received an academic degree for each year. Given that there are differences in the content of degrees from country to country, this discussion focuses on those people who have acquired degrees equivalent to bachelor's, master's, and doctoral degrees awarded in Japan (for details, see the cautionary notes in each chart).
Germany has begun adopting the common European standards for undergraduate (bachelor's) and graduate (master's) degrees in addition to its traditional first university degree, the Diplom.
(1) Number of bachelor's degrees awarded per 1 million population
Looking at numbers of persons who acquired bachelor's degrees per one million population, Japan stood at 4,373 in FY 2013. The countries with the largest numbers for the most recent available year were the U.K. followed by Korea; both exceeded 6,000. The U.S. also has a number that approaches 6,000. On the other hand, Germany and France have numbers for the latest available year that are lower than Japan's. However, until last year's edition “Japanese Science and Technology Indicators 2013” , the number of degrees awarded in Germany was calculated based on (1) the number of people completing specialized college, (2) the number of people acquiring bachelor's degrees, and (3) the number of people passing the Diplom exam (national exam) However, beginning with this year's edition, the number is calculated based on (1) and (2) only. Thus, it must be pointed out that values will differ from those appearing in “Japanese Science and Technology Indicators 2013” .
A comparison of growth rates between FY 2006 (FY 2007 in the case of Germany) and the most recent available year of each country shows that Japan's rate remained flat, France's rate fell, and the rates of the other countries rose. The U.K. saw particularly large growth.
When the composition ratio of subjects of special study is divided and examined in terms of “natural science and engineering (natural sciences, engineering, agricultural sciences, medical sciences, etc.),” “social sciences and humanities (social science, art, law, etc.),” and “others,” almost all of the countries had a large percentage in “social sciences and humanities.” However, care is required in the case of Korea, as “art,” which is ordinarily included in “others,” was placed in “social science and art.”
per one million population
(A) Bachelor's degrees holders
Note:
<Japan>
Accounted for college graduates as of March in the year noted.
“Others” are “General education
2012 is used for 2013 population data.
<U.S.>
Accounted for bachelor's degrees awarded in the year starting from September of the year represented.
“Science of medicine, Dentistry, Pharmaceutical sciences and Health sciences” include “Veterinary medicine” . “Others” includes “Military science” and “Interdisciplinary science” .
Field classifications are based on the classification method used in “International Comparison of Education Statistical Indicators.”
<Germany>
Accounted for the number of successful applicants in examinations for specialized college Diplom degrees and bachelor's degrees in the winter term of the year noted and summer term of the following year.
<France>
The number of college graduates in the year noted (calendar year). Bachelor's degree of national universities and colleges (3 years) and first degree in Science of medicine/Dentistry/Pharmaceutical sciences. The number of conferred “Diplome de docteur” (5 - 8.5 years). Accounted for “natural sciences,” “engineering” and “agricultural sciences” together.
<U.K.>
Accounted for the number of first degrees awarded from universities and higher education institutions in the year noted (calendar year) “Other” refers to mass communication and combined courses. Computer science is included in “natural sciences.” Values are for the United Kingdom and include international students.
<Korea>
Number of graduates from undergraduate programs (not including industrial colleges, technical colleges, and broadcasting/communications colleges) in March of the year noted. In 2006, “humanities/art” was “humanities” alone, and “art” was included in “others.” However, from 2012, “others” includes only physical education, and “art” is included in “humanities/art.” Accounted for “Natural sciences” , “Engineering” and “Agricultural sciences” together.
Source:
<U.S.> NCES, IPEDS, “Digest of Education Statistics.”
<Other countries> FY 2006 (Germany: FY 2007): MEXT, “International Comparison of Education Statistical Indicators”
Most recent fiscal year of each country: Data from the Ministry of Education, Culture, Sports, Science and Technology (MEXT) and Educational Media and Information Policy Division, Lifelong Learning Policy Bureau, MEXT
Population of each country is the same as for Reference Statistics A.
(2) Number of master's degrees awarded per 1 million population
Looking at the number of persons who acquired master's degrees per one million population in each country, Japan had an extremely small number with 615 in FY 2010. In terms of figures for the most recent available year in the surveyed countries, the U.K. was far ahead of the others with 3,884. Following were the U.S. (2,421) and Germany (2,129).
Regarding master's degrees data for Germany, the number of Diplom degrees, which can be obtained at ordinary universities, etc., is also counted with the number of master's degrees awarded in accordance with common European standards. Thus, it must be pointed out that values will differ from those appearing in “Japanese Science and Technology Indicators 2013” .
A comparison of FY 2006 (FY 2007 in the case of Germany) and the most recent available year shows that all of the countries had increases; however, the countries with the largest growth were France and the U.K. and that with the smallest was Japan.
A look at the compositional ratio by field of study shows a large share for “engineering” in Japan. On the other hand, the shares for “law, etc.” and “education/teacher training” were large in the other countries.
Note:
<Japan> Accounted for the number of master's degrees awarded from April of the year represented to March of the following year.
<U.S.> Accounted for the number of master's degrees awarded in the year starting from September of the year represented.
<Germany> Accounted for the number of master's degrees (standard one- or two-year course) and Diplom degrees awarded in the winter term of the year indicated or the summer term of the following year Successful applicants for teacher testing (national exam), etc., (including students other than those in education/teacher training faculties that passed teacher testing) are included in “education/teacher training” under the Diplom program.
<France> The number of master's degrees awarded (5 years) in the year noted (calendar year). Other notes are the same as provided for France in Chart 3-4-1 (A).
<U.K.> Accounted for the number of advanced academic degrees awarded from universities and higher education colleges in the year noted (calendar year). Other notes are the same as provided for the U.K. in Chart 3-4-1 (A).
<Korea> The number of master's degrees awarded from March of the year represented to February of the following year. Other notes are the same as provided for Korea in Chart 3-4-1 (A).
Source:
Same as for Chart 3-4-1 (A).
(3) Number of doctoral degrees awarded per 1 million population
Looking at the number of persons who acquired doctoral degrees per one million population in each country, Japan had an extremely small number with 131 in FY 2010. The countries with the largest numbers were Germany followed by the U.K.; both exceeded 300. The U.S. and Korea were at roughly the same level with approximately 250.
A comparison of FY 2006 (FY 2007 in the case of Germany) and the most recent available year of each country shows that all countries except Japan had increases. The country with the strongest growth was Korea, followed by the U.K. and U.S. (see the cautionary notes for Chart 3-4-1 (C) regarding data on the U.S.).
As for composition ratio by field of study, in case of doctoral degrees awarded, the percentage for natural sciences and engineering was high in every country. In the case of Japan, “medical sciences, dentistry, pharmaceutical sciences, and health sciences” and “engineering” accounted for large shares. “Medical sciences, dentistry, pharmaceutical sciences, and health sciences” also had a large share in Germany, as did “engineering.” On the other hand, the largest share in the U.K. belonged to “natural sciences.”
Note:
<Japan> Accounted for the number of doctoral degrees awarded from April of the year represented to March of the following year.
<U.S.> Accounted for the number of doctoral degrees awarded in the year starting from September of the year represented. Here, figures for doctoral degrees awarded subtract figures for “legal economics,” “medicine, dentistry, pharmacy, and health care,” and “others” of first-professional degrees (bachelor of medicine and bachelor of law) from figures for “doctor's degrees” that are noted in the “Digest of Education Statistics 2012.”
<Germany> Accounted for the number of successful applicants in the examination for doctoral degree in winter term of the year represented and summer term of the following year.
<France> The number of doctoral degrees awarded (8 years) in the year represented (calendar year). Other notes are the same as provided for France in Chart 3-4-1 (A).
<U.K.> Accounted for the number of advanced academic degrees awarded from universities and higher education colleges in the year noted (calendar year). Other notes are the same as provided for the U.K. in Chart 3-4-1 (A).
<Korea> The number of doctoral degrees awarded from March of the year represented to February of the following year. Other notes are the same as provided for Korea in Chart 3-4-1 (A).
Source:
Same as for Chart 3-4-1 (A).
3.4.2 Doctoral degrees awarded in Japan
This section examines trends surrounding doctoral degrees awarded in Japan by major field of study.
Chart 3-4-2 shows changes in the number of doctoral degrees awarded. Viewed over the long term, the number of people who acquired doctoral degrees in Japan had been growing; however, this growth slowed upon entering the 2000s and a downturn had continued following the peak in FY 2006. However, in FY 2010, the number of people who acquired doctoral degrees grew to 16,760 (Chart 3-4-2).
A breakdown of the number for FY 2010 by major field of study shows that medical sciences (medicine, dentistry, pharmacy, and health care) had the highest share with 6,315, or 37.7% of the total. Following were engineering, which accounted for 3,693 (22.0%), and natural sciences, which accounted for 1,534 (9.2%). Looking at changes in the percentage of people who acquired doctoral degrees in natural sciences and engineering, natural sciences had a gradual during the 1980s that flattened out upon entering the 1990s. On the other hand, engineering began an increase from the early 1990s that flattened out in the early 2000s.
Notes:
1) “Medical sciences” refers to medical science, dentistry, pharmaceutical sciences, and health sciences.
2) “Education” , “Art” and “Home economics” are included in “Education” .
Source:
Until FY 1986, Education Research Center, Hiroshima University, “Higher Education Statistical Data (1989)” ; from FY 1987, data from MEXT
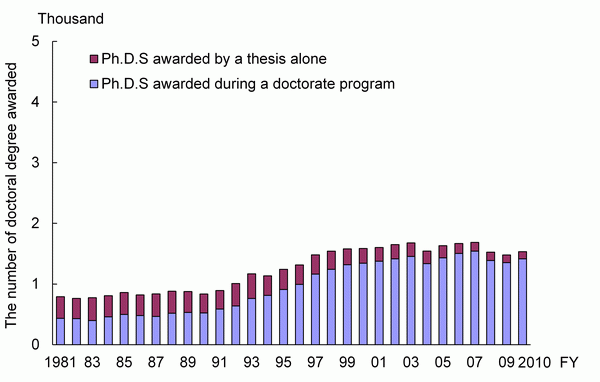
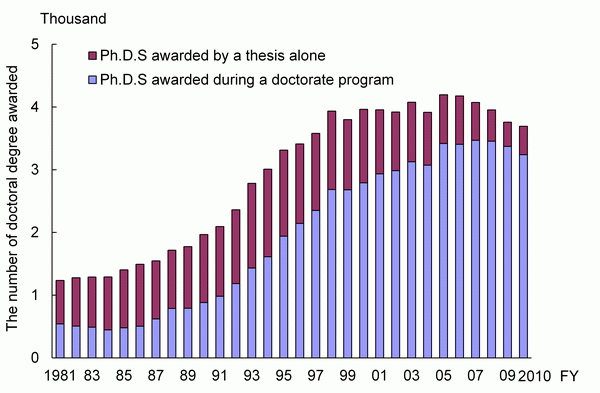
Chart 3-4-3 shows changes in the number of doctoral degrees awarded in natural sciences and engineering by a breakdown of degrees awarded during a doctoral program and those awarded by a thesis alone.
In 2010, the number of doctoral degrees awarded in natural sciences broke down into 1,415 awarded during a doctoral program and 119 conferred by a thesis alone. Looking at a breakdown of Ph.D.s awarded during a doctoral program and those conferred by a thesis alone, the number of the former exceeds the number of the latter in all years. It should be noted that the increase in the number of degrees awarded in recent years has been almost entirely due to those awarded during a doctoral program. The number of doctoral degrees awarded during a doctoral program had declined after peaking in 2006; however, it moved up again in FY 2010.
In 2010, the number of doctoral degrees awarded in engineering broke down into 3,240 awarded during a doctoral program and 453 awarded by a thesis alone. Looking changes in the breakdown, the number of degrees awarded by a thesis alone had surpassed those awarded during a doctoral program until the first half of the 1990s. However, since then, the number awarded during a doctoral program has risen remarkably, and recent increases in the number of degrees awarded are due almost entirely to such degrees. In FY 2010, 90% of all degrees awarded were those awarded during a doctoral program. It should be mentioned, however, that the number of degrees awarded during a doctoral program has also begun decreasing in recent years.
(by degrees award during a doctorate program/by a thesis only)
Note:
Same as Chart 3-4-2.
Sources:
Same as Chart 3-4-2.

