3.2 The status of students in higher education institutions
Key points
- New enrollment of undergraduates in Japan has been largely unchanged since 2000. In FY 2013 the number stood at 614,000. Looking at major fields, the numbers of new enrollment for “medical sciences” and “others” are increasing, while those “social sciences” and “engineering” are decreasing.
- The number of students newly enrolled in master's programs in FY 2013 totaled 73,000, which represents a continuous decline in the number since its peak in 2010. The number of new enrollments in “engineering,” which accounts for the largest share of new enrollments among the major fields of study, has fallen rapidly since 2010.
- The number of new enrollments in doctoral programs had been declining since peaking in FY 2003, but in FY 2010 it increased by 3.6% from the previous year. However, it subsequently had a continuous decrease, falling to 15,000 in FY 2013. Among the major fields of study, decreases are particularly conspicuous in “engineering” and “social sciences and humanities.”
- In FY 2013, the number of female students enrolling in undergraduate studies was 275,000, or 44.7% of all new enrollment. This number is demonstrating steady increases.
- Breaking down the numbers of students enrolling in Japan's undergraduate departments, master's programs, and doctoral programs by sex, the number of enrolling females is increasing in all areas. The number of enrolling males had been increasing until FY 2000 but decreased in all areas in FY 2013.
3.2.1 New enrollment of undergraduates
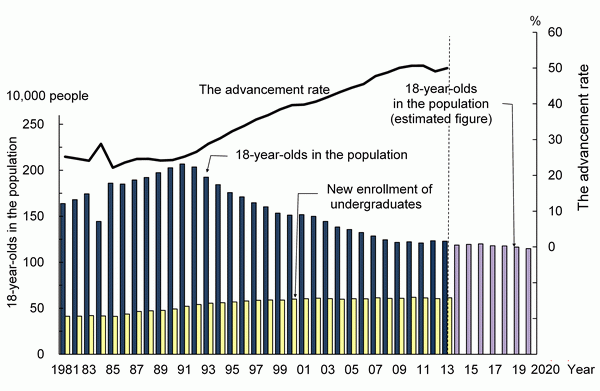
The number of 18-year-olds in the population has been decreasing from about 2,068,000 in 1991, which marked the peak. It is expected that this trend of decreasing will continue and estimated that the numbers will decline to about 1,149,000 in 2020, which 55.5% of the peak (see Chart 3-2-1).
Amid young people's growing desire to proceed to higher education and an increase in the number of student places, the number of students newly enrolled in undergraduate studies had shown continuing increases. However, its growth began to slow in the early 2000s. This number stood at 614,000 in FY 2013. The advancement rate (the ratio of the number newly enrolled to the total of 18-year-olds) is 50.0%, which represents an increase of 0.9 percentage points compared to the previous year.
Note:
1) 18-year-olds in the population is by medium estimation.
2) The number newly enrolled for undergraduate studies is the number of students who enrolled in a university or college in the year noted and were still registered as of May 1 (the date of the survey) the following year.
3) The advancement rate is the ratio of the numbers newly enrolled for undergraduate studies against 18-year-olds in the population.
Source:
1) 18-year-olds in the population: <until 2007> Ministry of International Affairs and Communications, Statistics Bureau, “Population Estimates” (as of October in every year).
<After 2011> National Institute of Population and Social Security research, “Population Projections for Japan: January 2012”
2) The numbers newly enrolled for undergraduate studies: MEXT, “Report on School Basic Survey”
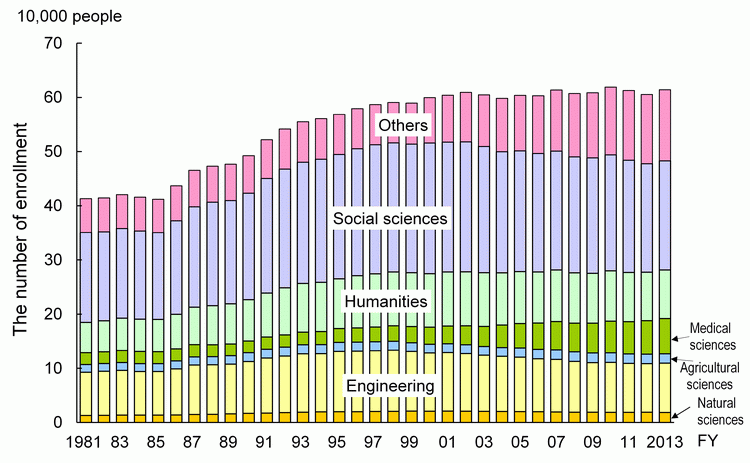
Chart 3-2-2 (A) shows changes in new enrollment of undergraduates by major fields. New enrollment of undergraduates in Japan has been largely unchanged since FY 2000. In FY 2013, the number was 614,000, which represented a year-on-year increase of 1.5%.
Breaking down the number of new enrollment for the most recent available year, the field of “social sciences” had 202,000 newly enrolled students, while “humanities” had 90,000. In the “natural science and engineering” fields, “engineering” had about 91,000 newly enrolled students, “medical sciences” about 65,000, “natural sciences” about 19,000, “agricultural sciences” about 17,000, and “others (the total of home economics, education, art, and others) about 131,000.
Looking at changes over time, the numbers of new enrollment for “medical sciences” fields and “others” have been increasing since the early 2000s, while those for “social sciences” and “engineering” fields have been decreasing.
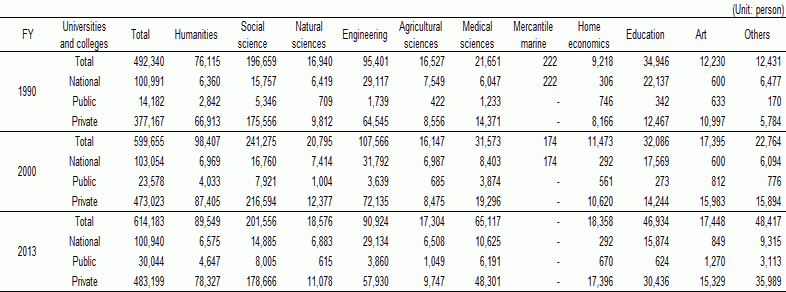
When the number of newly enrolled undergraduates is sorted by national, public, and private universities (Chart 3-2-2 (B)), new enrollment in private universities and colleges constitutes 80% of the total. Consequently, it is thought that the number of new enrollment in private universities and colleges has a profound impact on changes in the number as a whole.
By field, students majoring in “Natural sciences and engineering” accounted for about 30% of the total. It should be noted that a large share of the new enrollment in private universities and colleges was in the “social sciences.” However, the composition ratio looking at private universities and colleges as a whole shows the trend that “Social sciences” has been decreasing. Meanwhile, the large number of the new enrollment in national universities and colleges is in “Engineering” . The increase in “Others” is largely a result of the increase in the new enrollment in “private universities and colleges” .
Note:
The “others” in (A) are “mercantile marine” , “home economics” , “education” , “art” and “others”
Source:
MEXT, “Report on School Basic Survey”
3.2.2 New enrollment in master's programs in graduate schools
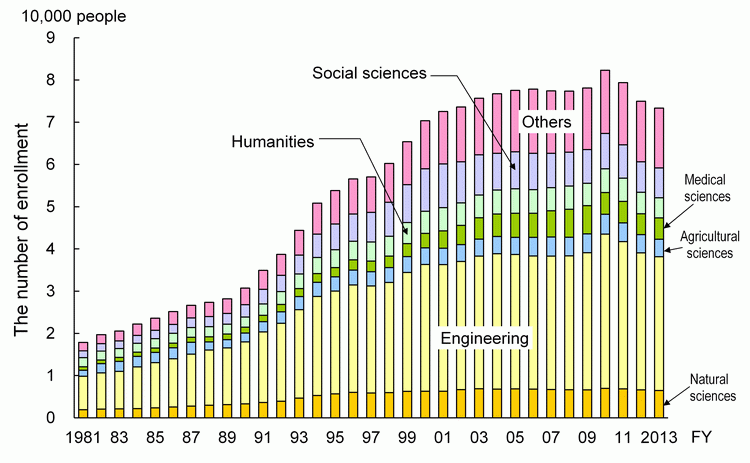
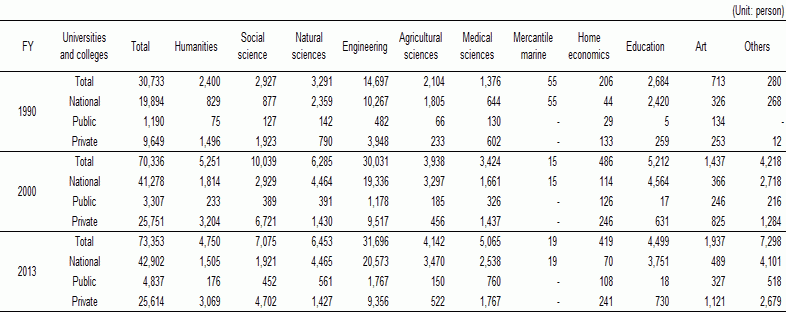
The number of new enrollments in graduate school master's programs increased greatly from FY 1990 to FY 2000, partly due to increasing focus on graduate school education since 1990. During this period, the number of new enrollments in master's programs increased by 2.3 times. This growth began to slow upon entering the 2000s. The number of students newly enrolled in master's programs totaled 73,000 in FY 2013. This figure represented a decrease of 2.6% compared to the previous fiscal year and a continuing decline following a peak in 2010.
Breaking down this number by major field of study for the most recent available year, “engineering” had the largest share with 32,000, followed by “social sciences” with 7,000, “natural science” with 6,000, and “medical sciences” with 5,000. Looking at changes over time, the number of new enrollments in “engineering,” which accounts for the largest share of new enrollments among the major fields of study, has shown a substantial decrease since 2010, and thus has a significant influence on decreases in the overall number (Chart 3-2-3 (A)).
Looking at the trend of the number of new enrollments in master's programs by national, public and private universities and colleges, the trend was different from that for undergraduates. National universities and colleges accounted for about 60% of the total. By major, “Natural science and engineering” accounted for the largest share at national, public and private universities and colleges. Private universities and colleges had relatively high new enrollments in “Social sciences and humanities.” (Chart 3-2-3 (B))
by national, public and private universities and colleges
Note:
The “Others” in (A) are “Mercantile marine” , “Home economics” , “Education” , “Art” and “Others”
Source:
MEXT, “Report on School Basic Survey”
3.2.3 New enrollment in doctoral programs in graduate schools
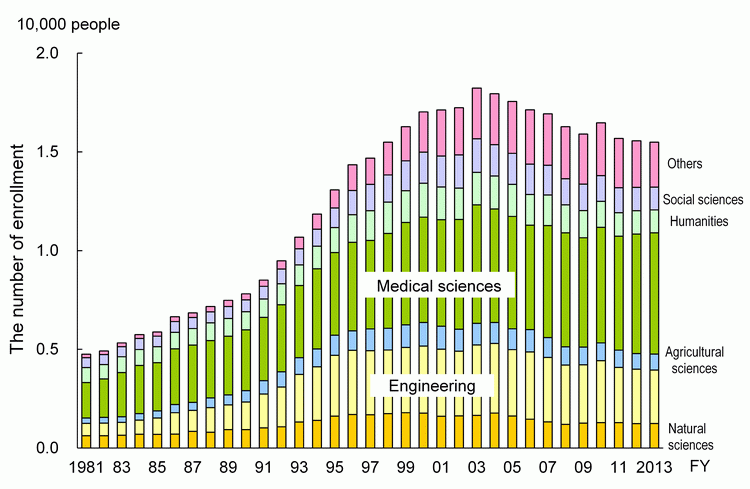
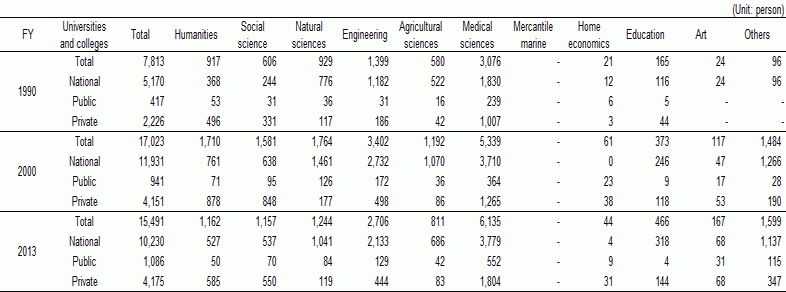
The number of new enrollments in graduate school doctoral programs had been declining since peaking in FY 2003, but in FY 2010 it increased by 3.6% from the previous year. However, it subsequently had a continuous decrease, falling to 15,000 in FY 2013.
Breaking down this number by major field of study for the most recent available year, “medical sciences” and “engineering” had large shares, accounting for 6,000 and 3,000, respectively. “Natural science,” “humanities,” and “social sciences” each had around 1,000 new enrollments.
Looking at changes over time, the number has fallen or remained flat for all majors since the first half of the 2000s. Decreases are particularly conspicuous in “engineering” and “social sciences and humanities.” On the other hand, “medical sciences” has shown an upward trend in recent years (Chart 3-2-4 (A)).
A look at the numbers of new enrollments in graduate school doctoral programs in national, public, and private universities shows that national universities have a roughly 70% share of the total. By major, national universities have shares of between 80 and 90% in the fields of “Natural science,” “Engineering,” and “Agricultural sciences” and a 60% share of “Medical sciences.” Thus, a high percentage of students majoring in “Natural science and engineering” enrolled in national universities.
The number of new enrollments in graduate school doctoral programs has increased largely since the beginning of the 1990s. This resembles the increase in the number of new enrollments in graduate school master's programs. The number of new enrollments in master's programs had been flat since the mid-2000s, while that of enrollments in doctoral programs had been decreasing since peaking in 2003. Both the number of new enrollments in master's programs and that of new enrollments in doctoral programs similarly increased in FY 2010 but showed continuous decreases in subsequent years. (Chart 3-2-4(B)).
by national, public and private Universities and Colleges
Note:
The “Others” in (A) are “Mercantile marine” , “Home economics” , “Education” , “Art” and “Others”
Source:
MEXT, “Report on School Basic Survey”
3.2.4 Female enrollment
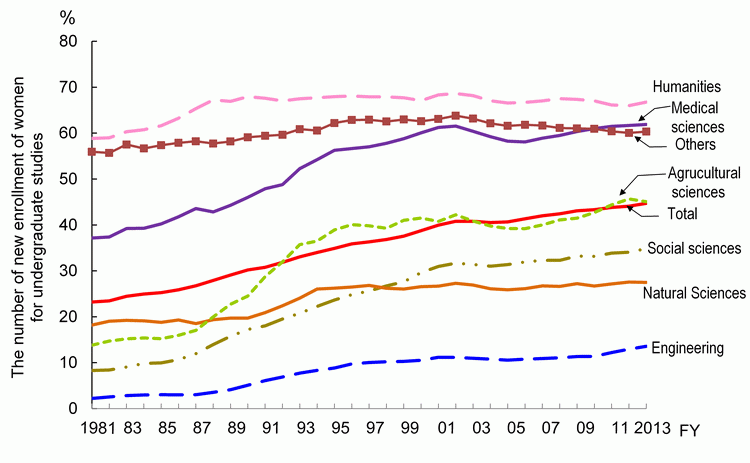
In FY 2013, the number of female students enrolling in undergraduate studies accounted for 44.7% of all new enrollment. This number is demonstrating steady increases (Chart 3-2-5). Looking at this situation by field, that with the largest share was “humanities” ; however, this share has shown little movement over time. Following is “medical sciences,” which has grown by approximately four times since FY 1990 and is showing the greatest increase compared to the other fields.
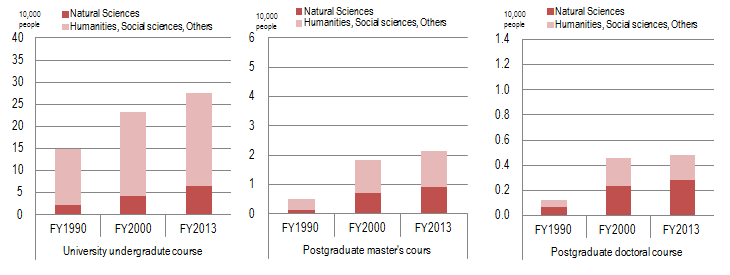
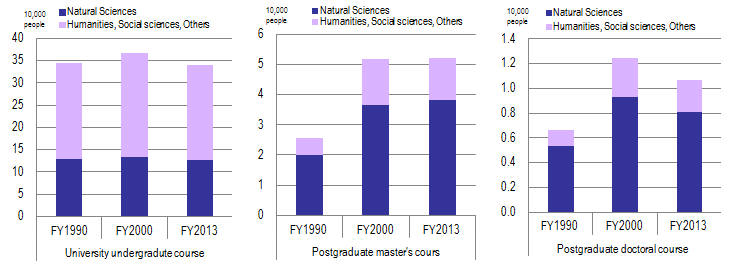
Breaking down the numbers of students enrolling in Japan's undergraduate departments, master's programs, and doctoral programs by sex, the number of enrolling female students is increasing (Chart 3-2-6). Although many female students majored in “humanities, social sciences, or other” when they enrolled in undergraduate study, the number majoring in “natural sciences” showed a comparative increase with higher levels of education.
On the other hand, the number of enrolling males had been increasing until FY 2000 but decreased in all areas in FY 2013. Additionally, while the number enrolling in “natural sciences” continues to grow for master's programs, it decreased in FY 2013 for undergraduate departments and doctoral programs.
Source:
MEXT, “Report on School Basic Survey”
in undergraduate departments, master's programs, and doctoral programs (males and females)
Source:
MEXT, “Report on School Basic Survey”
3.2.5 Mature students in higher education institutions
Utilization of higher education institutions to give opportunities for the reeducation of people in the working world who are highly motivated to study is helpful to advance the cultivation of excellent human resources and use them. Moreover, it contributes to energizing society as a whole.
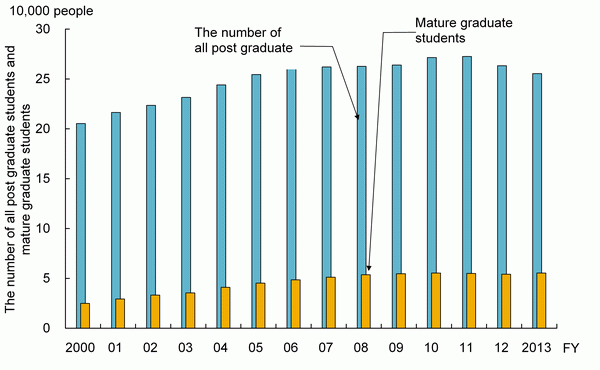
The number of mature graduate students in Japan had shown consistent increases until peaking in FY 2010. However, the number rose again in FY 2013; of all postgraduate students, the number of mature graduate students was 55,000, which accounts for 21.7% (Chart 3-2-7).
Notes:
1) “Mature” refers to persons who are entered into employment to receive routine income such as pay or wages as of May 1st in each year; it includes retired employees and housewives.
2) Postgraduate students here are persons who are registered in a master's program and the preliminary term of a doctoral program, or in a doctoral program and the latter term of doctoral program, and in professional graduate schools.
Source:
MEXT, “Report on School Basic Survey”
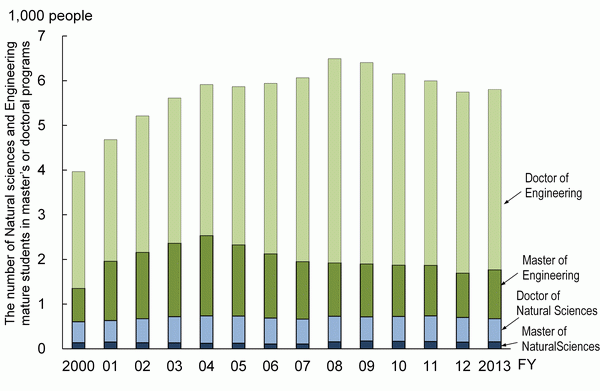
Looking at the number of mature graduate students in “natural sciences” and “engineering” by degree, 4,036 were enrolled in doctoral programs in “engineering” in FY2013; this figure continues a decreasing trend that follows a peak in FY 2008. The number of mature graduate students in master's programs in “engineering” has been on a downward trend since FY2004; however, it rose again in FY 2013 to reach 1,095.
Mature students enrolled in doctoral courses in “natural sciences” during FY2013 numbered 518. Those in master's courses in “natural sciences” numbered 156. The number of mature students enrolled in doctoral courses in “natural sciences” has been decreasing since the mid-2000s; on the other hand, the number enrolled in master's courses had been in a continuous decline from FY 2009 before rising again in 2013 (Chart 3-2-8).
in natural sciences and engineering
Source:
MEXT, “Report on School Basic Survey”

