2.3 Research assistants
Key points
- With regard to the number of research assistants per researcher by sector, the number of research assistants in the universities and colleges sector is smaller than in other sectors in Japan, Germany, France, the U.K. and China. The number of research assistants in the universities and colleges sector is large in Korea. Over time, growth has been flat or has declined in almost all the countries, but it has been increasing in Korea since 2000.
- Looking at a breakdown of Japan's universities and colleges sector, administrators and others began to increase in the early 2000s, while research assistants began increasing from the mid-2000s.
- The number of research assistants per researcher in Japan's universities and colleges sector has remained relatively unchanged.
- Among national, public and private universities in Japan, the number of research assistants per researcher is highest at national universities. Looking at trends by field of study, the number has particularly increased since 2000 in the fields of natural sciences and agriculture.
2.3.1 Status of research assistants in each country
Research assistants tend to be recognized as being peripheral despite the fact that they are important participants in R&D. However, both researchers and research assistants play important roles in modern R&D as it becomes more complicated and larger in scale.
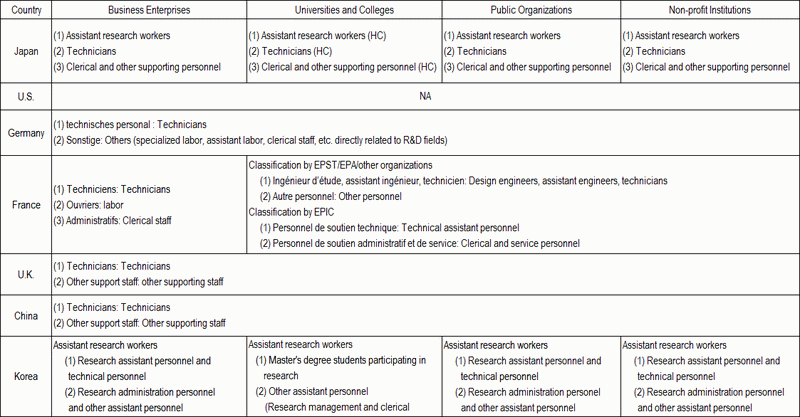
Each country keeps statistics on the number of research-related personnel, including research assistants,; however, as in the case of the number of researchers, these statistics vary from country to country.. Nonetheless, “technical and equivalent staff” (12) and “other supporting staff” (13) as defined by the OECD's “Frascati Manual” correspond to so-called research assistants.
Chart 2-3-1 shows the names of elements that comprise “research assistants” . For Japan, France and Korea, the terms found in the questionnaire for the statistical survey of R&D was used. For Germany, the terms in R&D documents were used. For the U.K. and China, the terms in documents compiled by the OECD were used. There was no data for research assistants in the U.S.
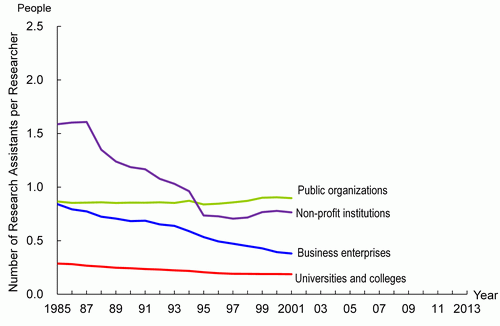
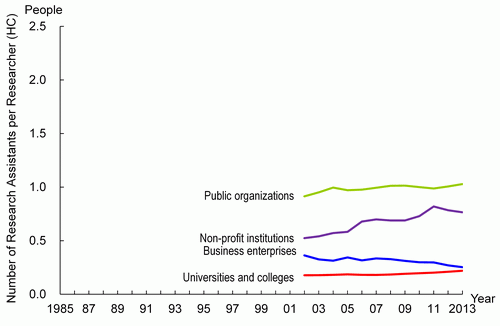
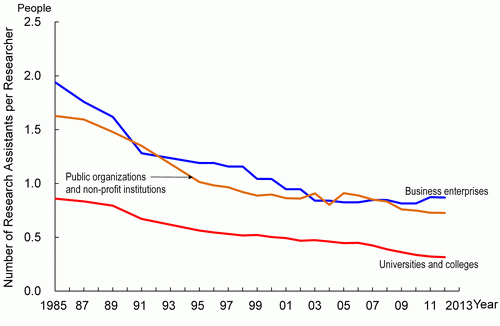
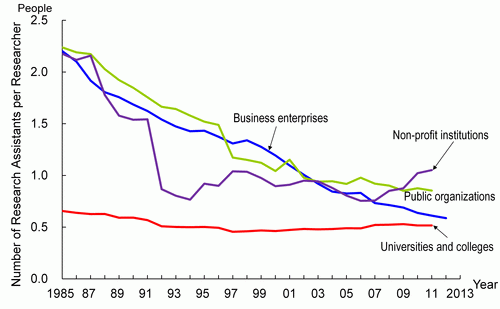
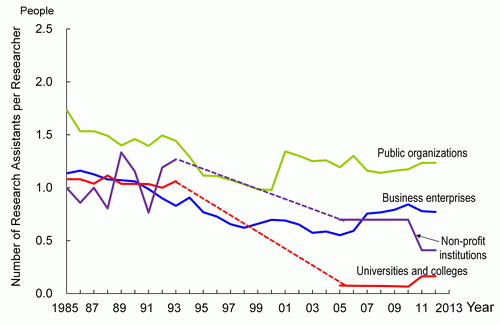
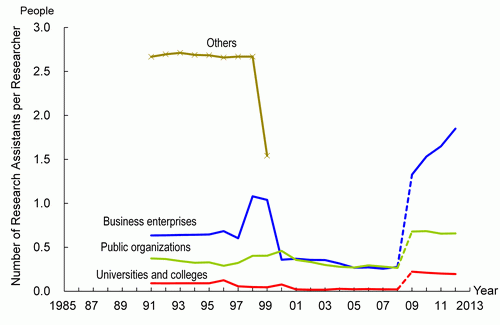
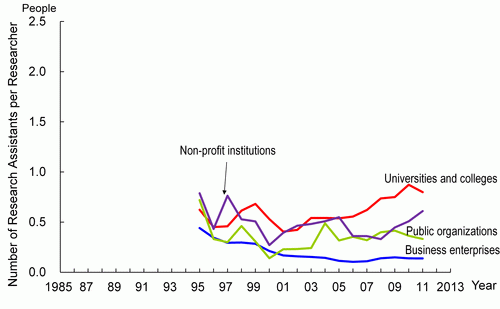
Chart 2-3-2 shows the number of research assistants per researcher (hereinafter referred to as “number of research assistants” ) by sector.
Looking at Japan's most recent available year, the number of research assistants in public organizations is high at 1.03, while in the universities and colleges sector the number is low at 0.22. Over time, the number of research assistants in non-profit institutions has been increasing. Other sectors have stayed flat, while the business enterprises sector is showing a downward trend.
In the most recent available year for Germany, the number of research assistants was 0.73 in the public organizations and non-profit institutions sectors. This was higher than the 0.32 for the universities and colleges sector. Over time, the number has been decreasing in each sector.
In the most recent available year for France, the number of research assistants in the public organizations sectors was 0.85, while that for the non-profit institutions sector was 1.05. It was 0.61 in the business enterprises sector and 0.52 in the universities and colleges sector. Over time, the number has been flat in the universities and colleges sector and has declined sharply in the other sectors.
For the U.K., there are no data for non-profit institutions and universities from 1994 through 2004. It should be noted that the U.K. began announcing estimated figures for universities in 2005. The continuity of data from before 1994 and from 2005 on is therefore impaired. During the most recent available year, the number of research assistants was high in the public organizations sector and low in the universities and colleges sector.
China began counting researchers in accordance with OECD standards in 2009, so their number has decreased. Consequently, the number of research assistants increased dramatically in 2009.
In the most recent available year for Korea, the number of research assistants was large in the universities and colleges sector at 0.80 and small in the business enterprises sector at 0.14. This is the opposite of the situation in the other countries. Moreover, the number of research assistants in the universities and colleges sector has been increasing over time, which also differs from what is happening in the other countries.
Notes:
1) For the U.S., Germany and France, terms in their respective national languages are shown (this version is in Japanese). For the U.K. and China, terms used in OECD materials are shown.
2) Values for each country are FTE. However, values marked with (HC) are actual values.
3) No data are provided for the U.S.
Source:
NISTEP, “Metadata of R&D-related statistics in selected countries: Comparative study on the measurement methodology” (Research Material No. 143);
Ministry of Internal Affairs and Communications, “Report on the Survey of Research and Development”
OECD, “R&D Statistics” (last updated Feb. 2009)

 (E) U.K.
 (F) China
Note:
1) The definition and measurement methods of research assistants are different depending on the country or sector. Therefore care is required when making international comparisons. Refer to Chart 2-3-1 for the differences in research assistants.
2) The note for researchers is the same as for Chart 2-1-1.
3) FTE values were used in each country. But a part of Japan's data was HC values.
4) “Japan*” used the values in accordance with Chart 2-1-2(A) (Values represent the number of researchers mainly engaged in research, and were not measured on FTE basis. External non-regular researchers were not covered.)
5) “Japan (HC)” used values in accordance with Chart 2-1-2 (A)(3) (the total number of researchers “mainly engaged in research” and “engaged in research under non-regular conditions” . The number of researchers in universities and colleges sector includes the number of above mentioned “external non-regular researchers” )
6) For France, the U.K., China, and Korea, the values for “non-profit institutions” were found by subtracting business enterprises, universities and public organizations from the total number of research assistants.
7) No data for assistants at U.K. universities and non-profit institutions are available for 1994-2004; data beginning in 2005 are national estimates or estimated values. Because the values may have been underestimated, or may be based on underestimated data, caution is necessary when making comparisons over time.
8) Through 2008, the definition of researcher used in China was not in complete accordance with the OECD. The measurement method was changed in 2009. Caution is therefore necessary when observing changes over time.
Sources:
<Japan> Ministry of Internal Affairs and Communications, “Report on the Survey of Research and Development”
<Germany> Bundesministerium fur Bildung und Forschung, “Bundesbericht Forschung 1996, 2000, 2004” ; “Forschung und Innovation in Deutschland 2007” “Bundesbericht Forschung und Innovation, 2008, 2010, 2012” ; OECD, “Main Science and Technology Indicators 2013/2” since 2010.
<Other countries> OECD “Main Science and Technology Indicators 2013/2”
2.3.2 Status of research assistants in the universities and colleges sector in Japan
(1) Breakdown of the number of research assistants
As mentioned in Section 2.3.1., Japan's research assistants consist of “technicians” , “assistant research workers” and “clerical and other supporting staff” . In this section, details on research assistants in the universities and colleges sector in Japan are examined.
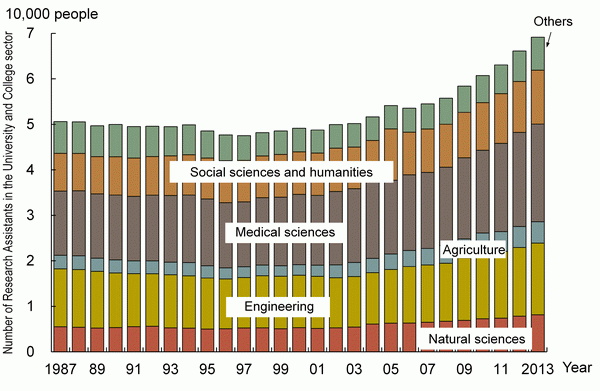
Chart 2-3-3 shows the number of research assistants by the academic field of their affiliation. In 2013, there were 69,000 research assistants. Their numbers have been increasing since around 2000; increases are mainly seen in the fields of natural sciences, agriculture, and medical sciences.
Source:
Ministry of Internal Affairs and Communications, “Report on the Survey of Research and Development”
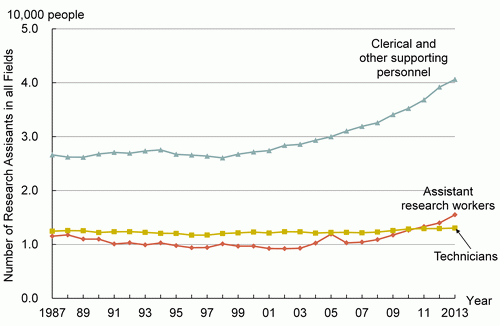
Next, looking at the breakdown of the number of research assistants, the number of “clerical and other supporting personnel” , which accounts for the largest proportion of the total, has been increasing since 2000. It stood at 41,000 people in 2013 (Chart 2-3-4 (A)).
The above-mentioned increase seems to have been caused by the revision of a cabinet order on the Act for Securing the Proper Operation of Worker Dispatching Undertakings and Improved Working Conditions for Dispatched Workers in FY 1997, which added “research tasks related to sciences” to the list of temporary tasks permitted and as a result enabled temporary researchers to be employed. Another likely cause is a decision to enable research institutes to employ research assistants who are necessary for the accomplishment of scientific research covered by grants in aid from FY 2001.
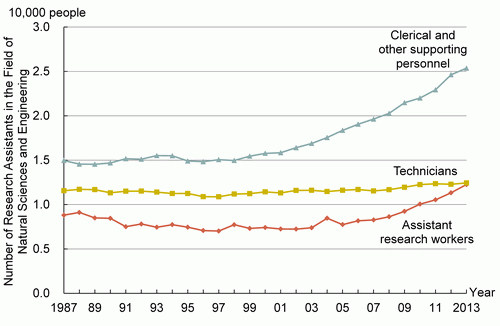
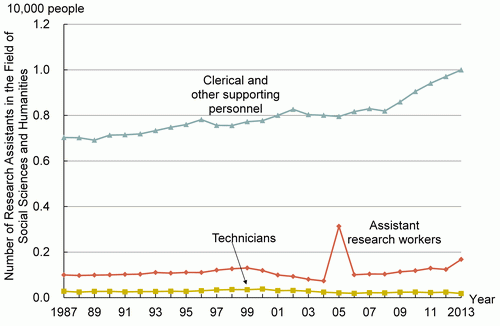
The breakdown of the number of research assistants by the academic field of their affiliation shows that the number of “clerical and other supporting personnel” is highest both in the field of “natural sciences” and the field of “social sciences and humanities” as it was in the breakdown of the total. But the number of “technicians” and “assistant research workers” is substantially larger in the field of “natural sciences” compared to that in the field of “social sciences and humanities” (Chart 2-3-4(B), (C)).
Note:
1) Expression “assistant research workers” represent s the people who assist “researchers” and work under the researchers' guidance.
2) Expression “technicians” represents the people who are not categorized as “researchers” nor “assistant research workers” and conduct research related auxiliary technical services under the guidance and supervision of “researchers” and “assistant research workers” .
3) Expression “clerical and other supporting personnel” represents the people who are not categorized as “assistant research workers” nor “technicians” , and work in general affairs, accounting and miscellaneous affairs.
Source:
Ministry of Internal Affairs and Communications, “Report on the Survey of Research and Development”
(2) Number of research assistants per researcher
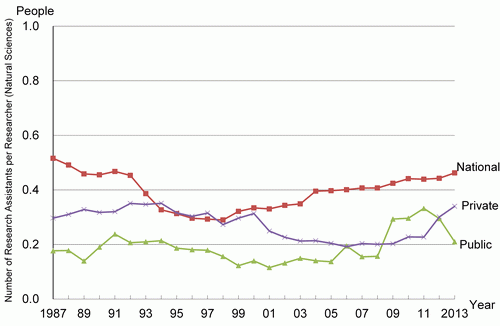
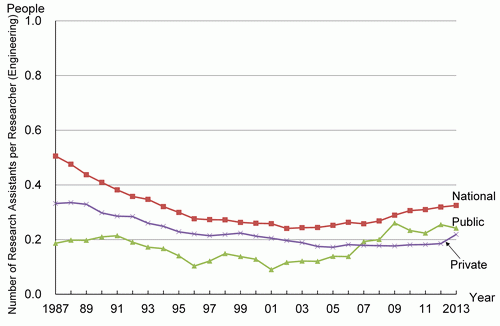
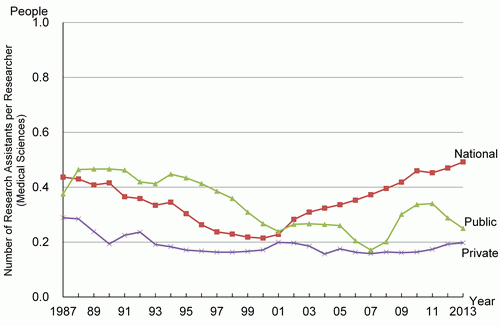
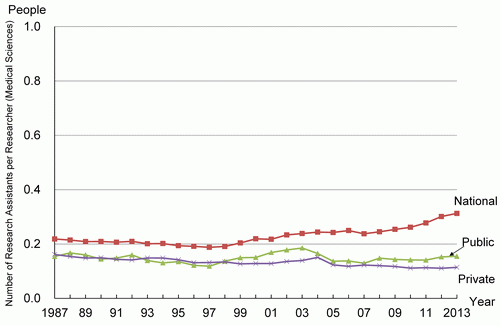
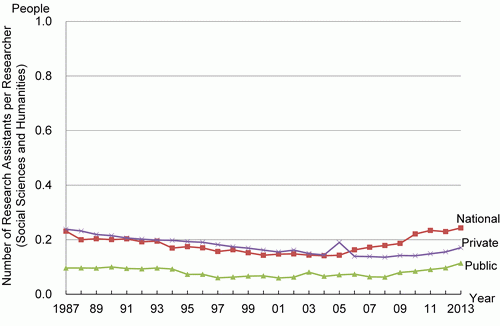
In this section, the ratio of the number of research assistants per researcher (regular researchers: other than external non-regular researchers) by field of their affiliation is examined in order to determine whether or not the values differ depending on the type of university (national, public or private). (See Chart 2-3-5.)
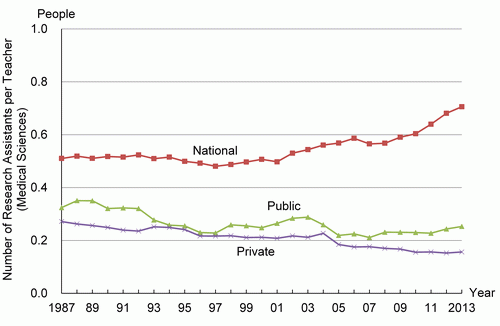
The number of research assistants per researcher is large in national universities in every field. Moreover, the numbers for all fields have been increasing since the beginning of the 2000s. The share of private universities has been increasing within the “natural sciences” field in recent years. In the field of “medical sciences” , the number of research assistants per researcher is small, and the difference with the research assistants per teacher in Chart 2-3-6 is significant. This difference, however, is due to the huge number of “medical staff and others” in this field compared to the other fields. In other words, the large number of researchers or the large denominator, rather than the small number of research assistants, influenced the result.
by type of university in each academic field
Source:
Ministry of Internal Affairs and Communications, “Report on the Survey of Research and Development”
(3) Number of research assistants per teacher
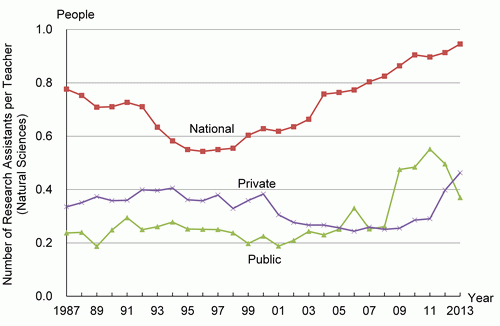
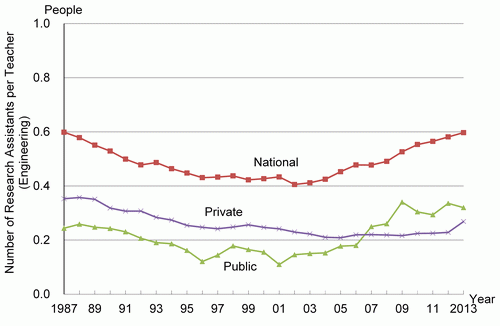
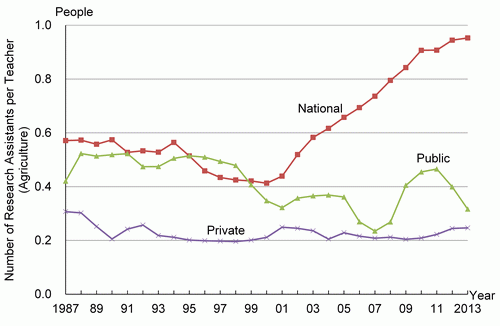
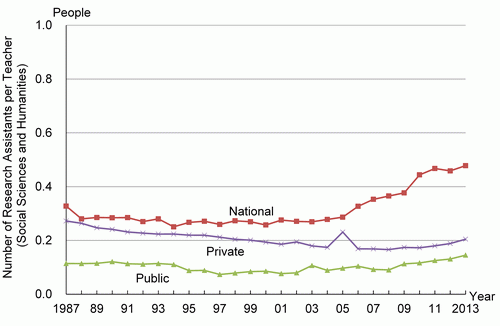
Regular researchers are composed of (1) teachers, (2) doctoral course students and (3) medical staff and others, and the proportion of (2) and (3) differs depending on the field. Therefore, in this section, (2) and (3) were excluded for the purpose of removing their influence. The number of research assistants per teacher by field of their affiliation is examined in order to determine whether or not the values differ depending on the type of university (national, public or private).
In every field, the number of research assistants at national universities is large and rising. In addition, the number of research assistants per teacher in the field of “natural sciences” and “agriculture” of “national universities” has a similar tendency of a decreasing trend until the 1990s which begins to rise in 2000. In the other fields as well, a rising trend at national universities becomes apparent during the mid-2000s (Chart 2-3-6).
Source:
Ministry of Internal Affairs and Communications, “Report on the Survey of Research and Development”
(12)“Technical staff and their equivalent” are people who are required to have technical knowledge and experience in one or more fields of study from among engineering, physics and life sciences, social sciences and humanities. They participate in R&D by accomplishing scientific and technical duties related to the application of concepts and practical methods usually under the guidance of researchers. The equivalent staffs accomplish duties related to R&D under the guidance for research in the field of social sciences and humanities.
(13)“Other supporting staff” includes skilled and unskilled craftsmen, secretaries and clerical staff who participate in R&D projects or are related to those projects.

