2.2 Researchers by sector
Key points
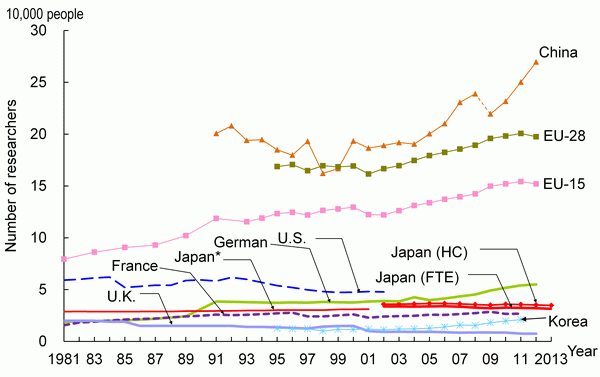
- The number of researchers in Japan's public organizations (FTE value) in 2013 was 32,000. No significant changes over time are apparent. Looking at the numbers of researchers in public organizations in each country, the country with the most conspicuous growth is China, which posted a figure of 270,000 in the latest available year.
- Looking at the number of researchers in the business enterprises sector, the number (FTE value) in Japan had been on a continually rising trend; however in recent years it has been flat. In 2013, there were 481,000 such researchers. China has shown a sharp upward trend beginning in the 2000s. Korea has also shown an upward trend during the same period, and it surpassed the European countries in the most recent available year. Germany and France have shown upward trends when viewed over the long term, while the U.K. has remained flat.
- Looking at numbers of researchers in Japan, the U.S., and Germany in terms of individual industrial classifications, the classification with the largest number is “information and communication electronics equipment” in the case of Japan, “computers, electronic products” in the case of the U.S., and “transport equipment” in the case of Germany.
- Looking at percentages of researchers by specialized field of study in Japan's universities and colleges sector (i.e., by field of personal specialized knowledge), the most researchers having knowledge in “natural sciences,” “engineering,” and “agriculture” are in national universities, which account for 60 to 70% of the total. In engineering, the share of these universities is growing year by year. Many researchers having knowledge in social sciences and humanities and “others” are in private universities. In the case of medical sciences, the shares of national universities and private universities were roughly the same.
2.2.1 Researchers in the public organizations sector
(1) Researchers in public organizations in each country
Below is a summary of what “public organizations” in this section represent. In Japan, “national” institutes (such as national testing and research institutes), “public” institutes (such as public testing and research institutes), and “special and public administrative corporations” are included.
In the U.S., research institutes run by the federal government are included.
In Germany, research institutes run by the federal government and local governments and other public research institutes, non-profit institutions (receiving 160,000 Euros or more as public funds) and the research institutes except for higher education institutions are included.
In France, types of research institutes such as scientific and technical research public establishment “Etablissement public a caractere scientifique et technologique” (EPST) (except for CNRS) and commercial and industrial research public establishment “Etablissement Public a Caractere Industriel et Commercial” (EPIC) are included.
In the U.K., research institutes run by the central government, decentralized governments, and research councils are included.
In China, research institutes run by the central government are included. And in Korea, national and public research institutes, government supported research institutes and national and public hospitals are included.
It should be noted that the number of researchers in the public organizations sector may fluctuate widely due to the privatization of public organizations and changes in what is subject to measurement with R&D statistics. The number of researchers in public organizations is examined in light of differences in each country. The number of researchers in Japan's public organizations (FTE value) in 2013 was 32,000. This number has not changed significantly over time.
The U.S. stopped publishing the number of researchers in public organizations in 2003.
Germany, France and the U.K., however, have shown remarkable fluctuation. The main reasons are thought to include the transfer of some public organizations into the business enterprises sector and changes in surveying methods for measuring the number of researchers. In the most recent available year, the number of researchers in Germany was 55,000. Germany's number has continued to grow since the mid-2000s.
The number of researchers in France has continued to grow when viewed over the long term.
China began making calculations in accordance with definitions in the OECD's Frascati Manual in 2009. Consequently, its 2009 value was considerably lower than its 2008 value. However, China's value has continued to increase since then and reached 270,000 in the most recent available year.
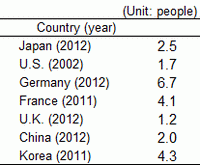
Next, looking at number of researchers in the public organizations sector per 10,000 population, Japan's number stood at 2.5. The country with the largest figure was Germany at 6.7. However, Germany's figure also includes its regional portion (state governments, etc.). In the U.K., both the number of researchers and their ratio per 10,000 population are small (Chart 2-2-1 (A, B)).


(A) Trends in the number of researchers in the public organizations sector
Note:
1) The definition and measurement method of researchers in the public organizations sector is different depending on country. Therefore it is necessary to be careful when international comparisons are being made. Refer to Chart 2-1-1 for the definition of researchers in each country.
2) Values for each country are FTE, except Japan (HC), which is HC.
3) Values include the number of researchers in social sciences and humanities (only in natural sciences and engineering in Korea through 2006).
<Japan>
1) National and public research institutes, special corporations and independent administrative corporations.
2) Refer to Chart 2-1-3 for researchers.
<U.S. >
1) The federal government only.
2) Out of “federal scientists and engineers” , only researchers who are mainly in charge of “research” and “development” as their work have been measured since 1998.
3) A part of the Department of Defense has been excluded since 2003.
<Germany>
1) The federal government, non-profit institutions (organizations which receives 160,000 Euros or more as public funds), legally independent university research institutes and research institutes run by local governments (Equivalent of local governments).
2) Former West Germany and unified Germany until 1990 and since 1991 respectively.
3) Figures for 2010 are national projections or estimated values.
<France>
1) Scientific and technical research establishment “Etablissement public a caractere scientifique et technologique” (other than CNRS), commercial and industrial research public establishment “Etablissement public a caractere industriel et commercial” , administrative research public establishment “Etablissement public a caractere administratif” (other than higher education institutions) and departments and agencies belonging to ministries.
2) Data continuity with the previous year is impaired for 1992, 1997 and 2000. Defense-related research is not included from 1997 on.
<U.K.>
1) The central government (U.K), decentralized governments (Scotland etc.) and research councils.
2) Continuity between values for 1981, 1986 (the U.K. Atomic Energy Authority was shifted to the business enterprise sector in 1985), 1991 to 1993, and 2001 (DERA(10) was shifted to the business enterprises sector in line with its dissolution in 2000) and data up to their previous fiscal years is impaired. Figures for 2010 are provisional.
<China>
1) Research institutes run by the government.
2) Through 2008, the definition of researcher used was not in complete accordance with the OECD. The measurement method was changed in 2009. Caution is therefore necessary when observing changes over time.
<Korea> National and public research institutes, government supported research institutes and national and public hospitals.
<E.U.>
1) OECD Secretariat estimate/projection based on each country's materials. Figures for 2009 and 2010 are provisional.
2) Data continuity with the previous year is impaired for the E.U.-15 for 1991 and 1993 and for the EU-28 for 1997.
Sources:
<Japan> Ministry of Internal Affairs and Communications, “Report on the Survey of Research and Development”
<Germany> Bundesministerium fur Bildung und Forschung, “Bundesbericht Forschung 1996, 2000, 2004” ; “Forschung und Innovation in Deutschland 2007” “Bundesbericht Forschung und Innovation, 2008, 2010, 2012” ; OECD, “Main Science and Technology Indicators 2013/2)” since 2010.
<U.S. France, U.K., China, Korea, and EU> OECD, “Main Science and Technology Indicators 2013/2”
(2) Researchers in the public organizations sector in Japan
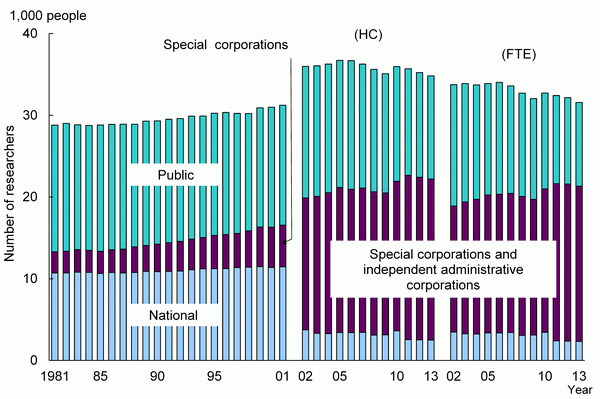
It should be noted that in Japan's public organizations sector, part of the “national” research institutes turned into independent administrative corporations in 2001 (furthermore, part of the “special” corporations also turned into independent administrative corporations in 2003). As a result, data since 2002 has had no continuity with the previous data. Given this background, the number of researchers in Japan's public organizations sector (FTE value) was 31,567 people in total in 2013. This figure has shown a long-term downward trend. When examined by type of organization, the number of researchers in “special and independent administrative corporations” accounts for more than half of the total, and this share is growing. On the other hand, “public” research institutes account for approximately 30%, and this share is continuing to decrease. Moreover, “national” research institutes account for slightly less than 10%, and this share is also decreasing (Chart 2-2-2).

Note:
1) Some national research institutes became independent administrative corporations in 2001. Accordingly, care is required when examining time-series trends.
2) Values for “special corporations and independent administrative corporations” until 2000 represent values for only “special corporations” .
3) Because of changes to the content and timing of surveys, the number of regular researchers as of April 1 were used until 2000 and the number as of March 31 have been used since 2001.
Source:
Ministry of Internal Affairs and Communications, “Report on the Survey of Research and Development”
Next is an examination of number of researchers by specialty. Specialty here represents a classification by specialized knowledge of individual researchers.
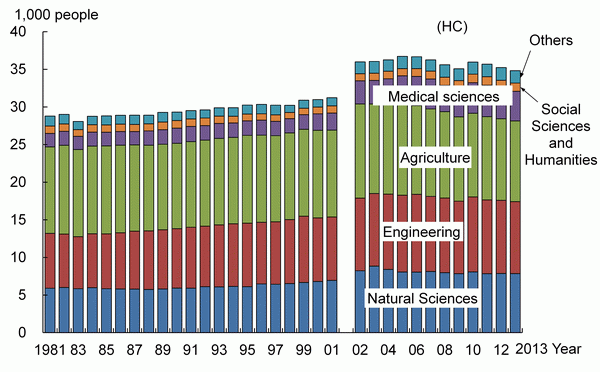
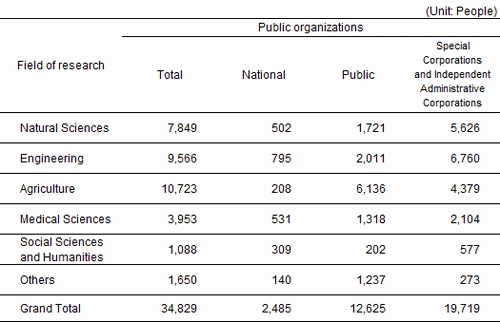
The number of researchers having specialized knowledge in “agriculture” has consistently accounted for a large proportion, although its share is gradually decreasing. Among the types of organization to which they belong, “public research institutes” is at the top in terms of the number of researchers. The number of researchers in the field of “engineering” makes up the second largest proportion. Many researchers in the field of “engineering” are affiliated with research institutes run by “special and independent administrative corporations.” The same is true for “natural sciences.” Many researchers in the field of “medical sciences” are affiliated with research institutes at special and public administrative corporations; however many are also affiliated with public research institutes (Chart 2-2-3).
(A) Trend in the number of researchers
Note:
Same as for Chart 2-2-2. HC values have been used since 2002.
Source:
Same as for Chart 2-2-2.
2.2.2 Researchers in the business enterprises sector
(1) Researchers in the business enterprises sector in each country
The number of researchers in the business enterprises sector is measured by statistical survey on R&D in every selected country. Therefore, the data for this sector is considered potentially more suitable for international comparison compared to that for other sectors. The same data, however, can show fluctuation over time. The fluctuation is influenced by the fact that, in each country, the methods and scopes of surveys change when they are adjusted to structural change in industries due to the sophistication of economic activities, and due to the revision of the standard classifications of industries.
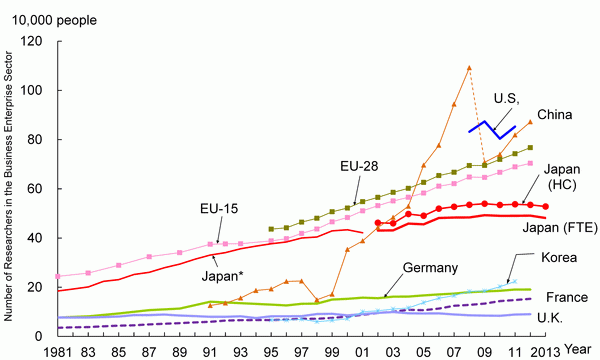
The number of researchers in the business enterprises sector (FTE value) in Japan had been on a continually rising trend, but in recent years it has been flat. In 2013, there were 481,000 such researchers.
The U.S. began conducting more detailed surveys of business enterprises in 2008. Because of this, no pre-2008 data are provided. The reader should note that there are discrepancies with data provided in last year's edition (Japanese Science and Technology Indicators 2013) and earlier editions. (For a discussion of the questionnaire survey of American business enterprises, the definition of “researcher,” and other relevant matters, see “Column: Circumstances of researchers who hold doctorates in American and Japanese business enterprises” in Section 2.1.3.) In 2011, there were 853,000 researchers in American business enterprises. This figure ranks the U.S. among the top countries in the world.
In France and the U.K., some public organizations were privatized and transferred to the business enterprises sector, causing a corresponding increase in researchers. Although not large enough to cause a significant change in the chart, Germany and France show long-term rising trends, while the U.K. is trending flat.
China showed rapid growth upon entering the 2000s. However, from 2009, China began making calculations in accordance with definitions in the OECD's Frascati Manual, and thus its values since then have been lower. However, it subsequently saw continuing growth, with its number of researchers reaching 872,000 in 2012.
Korea has shown a long-term upward trend, and it surpassed the European countries in the most recent available year (Chart 2-2-4).

Note:
FTE values were used.
<Japan>
1) Values until 2001 represent the numbers of researchers measured on Apr.1and since 2002 represent the numbers of researchers measured on Mar.31 in corresponding year respectively.
2) Refer to Chart 2-1-3 for what the researchers represent.
3) The industrial classification of the Survey of Research and Development was used based on the Japan Standard Industry Classification.
4) As industrial classification was revised, the classification adopted in the Survey of Research and Development was changed in its 1996, 2002 and 2008 versions.
<U.S.>
Industrial classifications use NAICS. No pre-2008 data are available.
<Germany>
1) West Germany until 1990 and unified Germany since 1991, respectively.
2) German Industrial classification, “Classification of Economic Activities” , was revised in 1993 and 2003.
3) Figures for 2008 are national projections or estimated values. Figures for 2010 are provisional.
<France>
1) Classification under the scope of surveys was changed in 1991 and 1992 (France Telecom and GIAT Industries was moved from the government sector to the business enterprises sector).
2) The survey method on research personnel in the administration sector was changed in 1997.
3) French industrial classification, “Nomenclature d'activites francaise “, was revised in 2001 and 2005.
4) Data continuity with the previous year is impaired for 2000 and 2005.
<U.K.>
1) The surveyed classifications were changed during 1985 and 1986, and in 2000 (“United Kingdom Atomic Energy Authority” was transferred from the government sector to the business enterprises sector during 1985 and 1986).
2) The Defense Evaluation and Research Agency (DERA) was abolished in 2000. Three-quarters of it was turned into limited private companies and transferred to the business enterprises sector.
3) Classification of research institutes was re-classified during 1991 and 1992.
4) The British industrial classification, “UK Standard Industrial Classification of Economic Activities,” was revised in 1980, 1992, 1997, 2003 and 2007.
5) Figures for 2010 are provisional
<China>
1) Through 2008, the definition of researcher used was not in complete accordance with the OECD.
2) Until 1999, figures were underestimated, or based on underestimated data.
Source:
<Japan> Ministry of Internal Affairs and Communications, “Report on the Survey of Research and Development”
<Germany> Bundesministerium fur Bildung und Forschung, “Bundesbericht Forschung 1996, 2000, 2004” ; “Forschung und Innovation in Deutschland 2007” “Bundesbericht Forschung und Innovation, 2008, 2010, 2012” ; OECD, “Main Science and Technology Indicators 2013/2)” since 2010.
<U.S., France, U.K., China, Korea, and EU> OECD, “Main Science and Technology Indicators 2013/2”
(2) Researchers by industry in each country
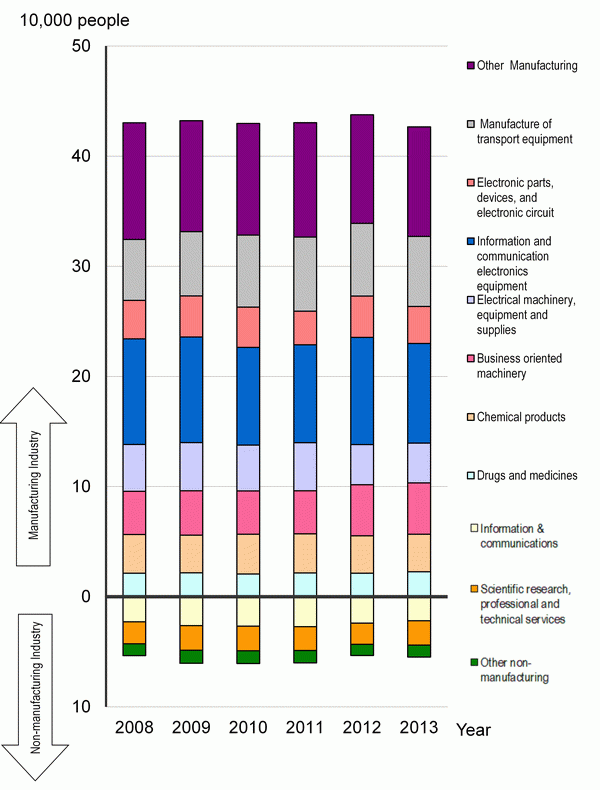
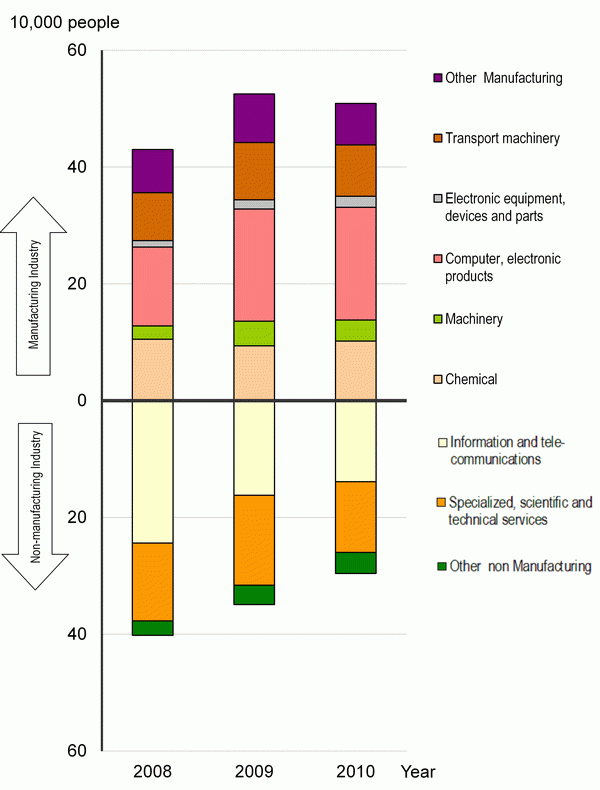
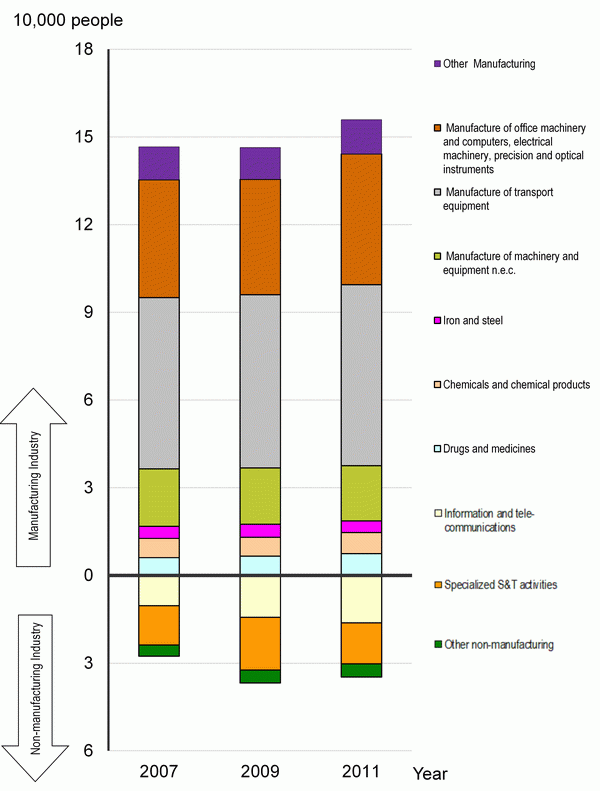
Chart 2-2-5 shows the number of researchers by industry in various countries. The business types used here were set for surveys of R&D statistics in the business enterprise sector, with reference to the standard industrial classifications used in each country. The standard industry types in each country generally follow the ISIC (International Standard Industrial Classification), but there is some variation by country.
Given the background mentioned above, an examination of the number of researchers by industry in Japan, the U.S., and Germany reveals that many researchers in Japan are affiliated with manufacturing industry. Thus, fluctuations in the overall number of researchers are thought to have a significant impact on manufacturing industry. In terms of individual industrial classifications, the classification with the largest number is “information and communication electronics equipment,” followed by “transport equipment.” No significant changes over time are apparent.
In the U.S., the number of researchers in non-manufacturing industry is large. Here, “information and communication electronics equipment” accounts for a large share. However, this share is decreasing. At the same time, the share of “scientific research, professional and technical services” is also large. As for manufacturing industry, the number is large and growing in “computers, electronic products.”
Germany resembles Japan in that many researchers are in manufacturing industry and few are in non-manufacturing industry. In terms of industrial classifications, “transport equipment” has a particularly large value, followed by “Computer, electronic, optical products.” In non-manufacturing industry, “specialized S&T activities” has a large number, as does “information and communications.”
Note:
Same as for Chart 2-2-4.
Source:
<Japan> Ministry of Internal Affairs and Communications, “Report on the Survey of Research and Development”
<U.S.> NSF, “Business R&D and Innovation Survey”
<Germany> BMBF,” Bundesbericht Forschung und Innovation 2012” ; Stifterverband Wissenschaftsstatistik, “FuE-Datenreport 2013”
(3) Density of the number of researchers against the total number of employees by industry for Japan
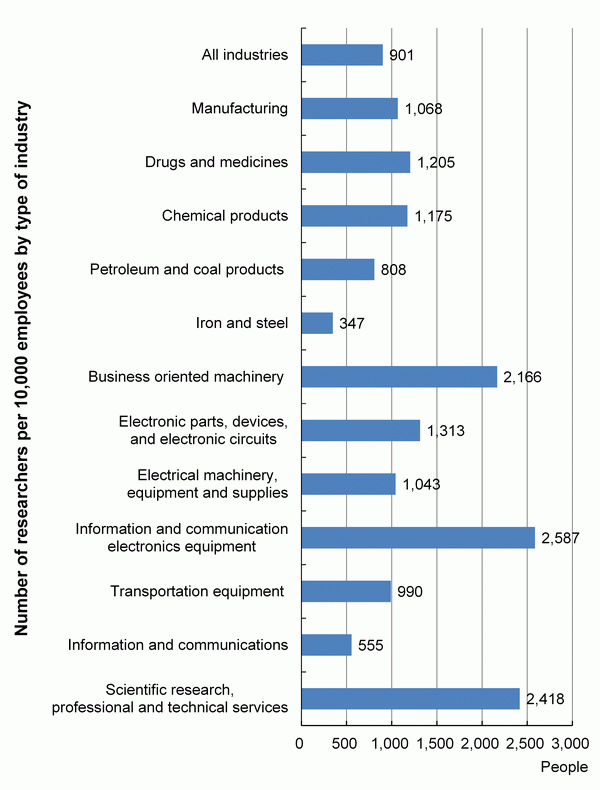
The number of researchers per 10,000 employees (whether or not researchers) was examined in some types of industries picked up in order to understand which types of industries and enterprises employ researchers in Japan (Chart 2-2-6). In 2013, the industry with the largest number was “information and communication electronics equipment” with 2,587. Next was “business-oriented machinery” with 2,166. “Scientific research, professional and technical services,” which is a non-manufacturing industrial sector, also had a large number with 2,418. It should be noted that the manufacturing industry of “information and communication electronics equipment” includes the manufacturing industries of telecommunication machinery and equipment, audio and video equipment, electronic computer, etc. The industry of “scientific research, professional and technical services” includes categories such as natural science research institutes and other academic institutions.
Source:
Ministry of Internal Affairs and Communications, “Report on the Survey of Research and Development”
2.2.3 Researchers in the universities and colleges sector
(1) Researchers in the universities and colleges sector in each country
International comparison of the number of researchers is difficult in the universities and colleges sector. The details were described in 2.1.1.; however, the main points that should be noted are restated below. (1) Differences in the method of survey: Some countries use existing data such as statistics on education (statistics measuring teaching staff and students) and on the status of occupations and academic degrees without conducting statistical surveys on R&D. (2) Differences in measurement methods: In cases where statistical surveys on R&D are conducted, it is possible to measure the number of researchers on an FTE basis based on questionnaires. However, in cases where the FTE values are measured in accordance with statistics on education etc., the values need to be obtained by multiplying full time equivalent coefficients. Japan is special because it conducts statistical surveys on R&D but does not obtain FTE values in these surveys. (3) Differences in the coverage of surveys: Doctoral degree holders included in researchers in the universities and colleges sector are treated differently in surveys depending on country. For instance, whether or not they receive financial assistance and whether or not full time equivalent coefficients are multiplied depends on each country. As for S&T indicators, Japan's Ministry of Education, Culture, Sports, Science and Technology carried out surveys in 2002 and 2008 in order to measure the FTE number of researchers in Japan's universities and colleges sector by finding an FTE coefficient. The value obtained using that FTE coefficient is used as the FTE number of researchers (see Chart 2-1-2). Data continuity between 2007 and 2008 is therefore impaired.
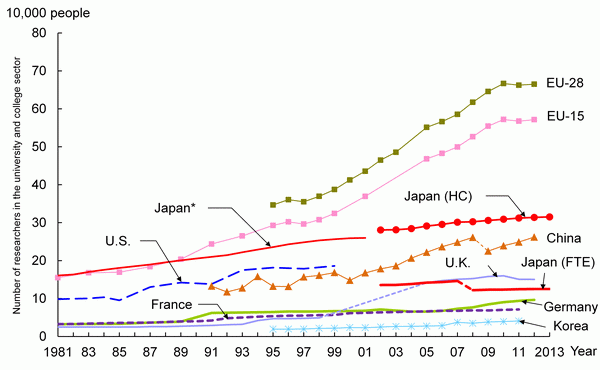
Given the above, a look at changes in each country over time shows that, in Japan, the number of researchers in the universities and colleges sector (FTE value) was approximately 125,000 people in 2012, a slight increase from 2008.
The number of researchers in universities and colleges of the U.S. has not been announced since 2000.
In Germany, slight increases have continued, with no major change other than the influence of the 1991 reunification of East and West Germany; however, an upward trend has been apparent in recent years.
In France, the number of researchers has been consistently on the rise.
In the U.K., the number of researchers surged during 1993 and 1994. However, this is considered the result of a change in the coverage of surveys due to reform of higher education institutions (the integration of universities and former polytechnics). It should be noted that there are no data for the U.K. for 1999 through 2004.
The number of researchers in China has been growing rapidly since 2000. It should be noted that China began making calculations in accordance with definitions in the OECD's Frascati Manual in 2009, and thus its values since then have been considerably lower than 2008 values.
In Korea, the number of researchers is rising, although there is still a gap with the other countries (Chart 2-2-7).


Note:
1) The definition and measurement method of researchers in the universities and colleges sector is different depending on the country. Therefore care is required when making international comparisons. Refer to Chart 2-1-1 for the differences in researchers in each country.
2) Values for each country are FTE, except Japan (HC), which is HC.
3) Values are the total of that in the field of the natural sciences and engineering and the field of social sciences and humanities (only natural sciences and engineering were included in Korea through 2006).
<Japan>
1) Faculties in universities (including graduate school courses), junior colleges, university research institutes. etc.
2) Refer to Chart 2-1-3 for researchers.
<U.S.> University & Colleges
<Germany>
1) Universities ,Comprehensive universities, Colleges of education, Colleges of theology, Colleges of art, Universities of applied sciences, Colleges of public administration
2) Former West Germany until 1990 and united Germany since 1991. respectively.
3) For 2012, estimated values have been corrected by the Secretariat to accord with national estimates and, where necessary, with OECD standards.
<France>
1) French National Centre for Scientific Research (CNRS), Grandes Ecoles (other than those under the jurisdiction of the Ministry of National Education [MEN]), higher education institutions.
2) Data continuity with the previous year is impaired for 1997 and 2000.
<U.K.>
1) Data continuity with the previous year is impaired for 1994 and 2005.
2) Figures for 2005 to 2008 are national projections or estimated values. For 2012, values are provisional values, national estimates, or estimated values that have been corrected by the Secretariat to accord, where necessary, with OECD standards.
<China> Through 2008, the definition of researcher used was not in complete accordance with the OECD. The measurement method was changed in 2009. Caution is therefore necessary when observing changes over time.
<Korea> All university and college majors (extension campuses and local campuses are included), university research institutes, university hospitals (only for the case that a medical university and its accounting department are integrated).
Source:
<Japan> Ministry of Internal Affairs and Communications, “Report on the Survey of Research and Development” ; MEXT, “Survey on the data for full-time equivalents in universities and colleges” (2002 and 2008)
<Germany> Bundesministerium fur Bildung und Forschung, “Bundesbericht Forschung 1996, 2000, 2004” ; “Forschung und Innovation in Deutschland 2007” “Bundesbericht Forschung und Innovation, 2008, 2010, 2012” ; OECD, “Main Science and Technology Indicators 2013/2” since 2010.
<U.S., France, U.K., China, Korea, and EU> OECD, “Main Science and Technology Indicators 2013/2”
(2) Researchers in the universities and colleges sector in Japan
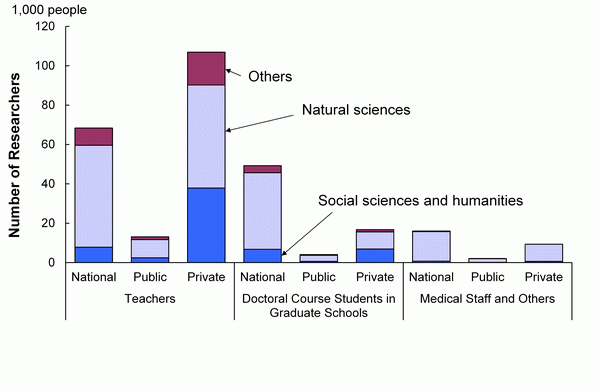
Chart 2-2-8 shows the number of researchers in the universities and colleges sector in Japan by type of researcher, by type of organization, and by academic field of study in Japan. The number of researchers in the universities and colleges sector in this section represents the number of “regular researchers” as stated in the “Report on the Survey of Research and Development,” which does not cover external non-regular researchers. This number was 285,986 people on March 31, 2013; 65.9% of those, or 188,391 people, are teachers. The number of researchers in the universities and colleges sector includes “doctoral course students in graduate schools (70,098 people)” and “medical staff and others (27,497 people).” In these statistics, almost all the teachers in universities are measured as researchers(11)。
Overall, teachers are most common at private universities, while doctoral course students in graduate schools are most common at national universities. Breaking down researchers at national universities by field, natural sciences is the most common field. This is also true of doctoral course students in graduate schools. At private universities, on the other hand, although natural sciences is the most common field, the humanities and social sciences field is also large, with little difference between the two.
Note:
Values are for universities and graduate schools
Source:
Ministry of Internal Affairs and Communications “Report on the Survey of Research and Development”
Next is the trend in the number of researchers by specialized field of study (Chart 2-2-9 (A)).
Here, “specialized field of study” means “by field of personal specialized knowledge” (however, priority is placed on a description of current duties when classification is difficult).
The total number of researchers is increasing, and researchers in the field of “medical sciences” and the field of “social sciences and humanities” account for the main elements of the entire structure.
(A) Trend in the number of researchers by specialized field of study
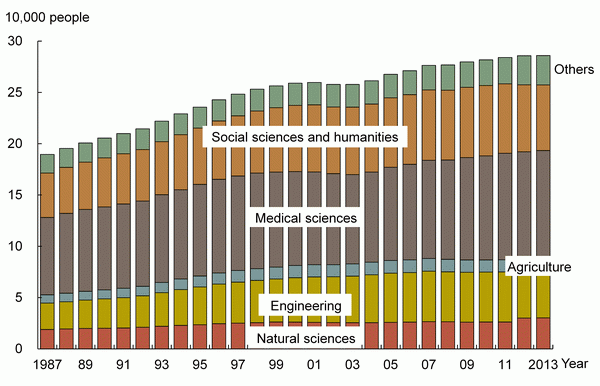
Furthermore, the proportion of researchers by type of university in each specialized field is examined.
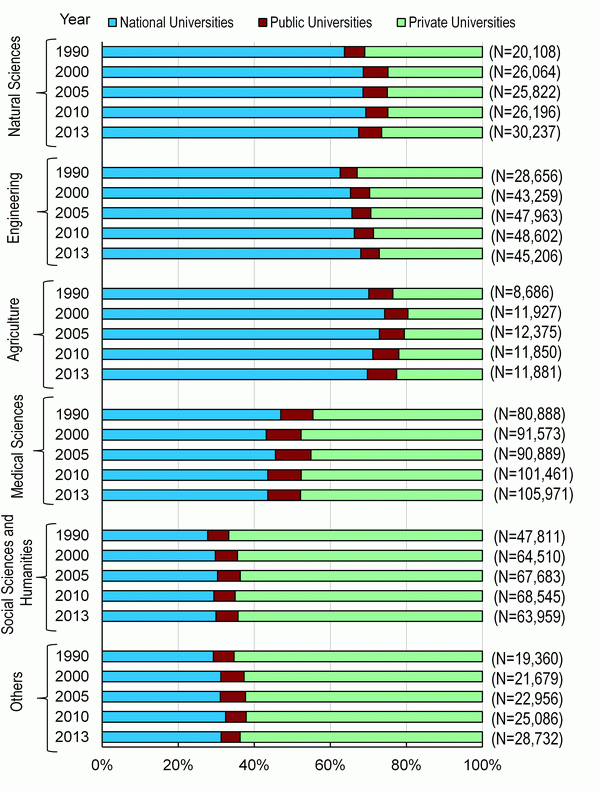
Chart 2-2-9 (B) shows the proportions of the number of researchers by type of university (in other words, national, public, or private university) after classifying them by the field of their personal specialized knowledge.
The number of researchers in “national universities” accounts for large proportion, 60 to 70% of the number of researchers with knowledge in the field of “natural sciences” , “engineering” and “agriculture” . With regard to the field of “engineering” , the proportion is increasing year on year. The number of researchers in “private universities” accounts for a large proportion of the number of researchers with knowledge in the field of “social sciences and humanities” and “others” . Researchers in “medical sciences” have been about equally common at “national universities” and “private universities” , although in 2000, 2010, and 2013 there were more at private universities.
in each personal specialized field of study
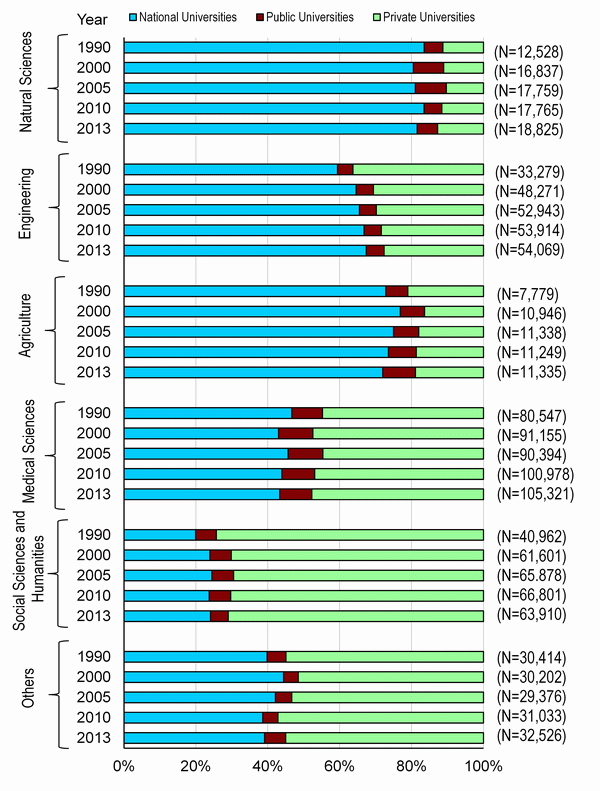
Next, the proportion of researchers by type of university in each field of affiliation (academic field) is examined (Chart 2-2-9 (C)). This proportion is almost the same as in the case for each specialized field of study (Chart 2-2-9 (B)). However, the number of researchers in “national universities” accounts for a substantial 80% or more of those whose affiliation is in the field of “natural sciences” , while the proportion in “private universities” accounts for only approximately 10% of the same.
The fact of the matter is that the number of researchers in “private universities” accounts for 20% to 30% of the number of researchers whose personal specialized field is “natural sciences” , while only approximately 10% of researchers in “private universities” have affiliations related to “natural sciences” . This means that researchers who have specialized knowledge in “natural sciences” in “private universities” do not necessarily have affiliations related to “natural sciences” .
in each academic field of affiliation
Source:
Ministry of Internal Affairs and Communications, “Report on the Survey of Research and Development”
(3) Greater diversity in the alma maters of university teachers
In Japan, traditionally many teachers currently working for a university graduated from the same university. Therefore the diversification of teachers’ alma maters is a policy objective.
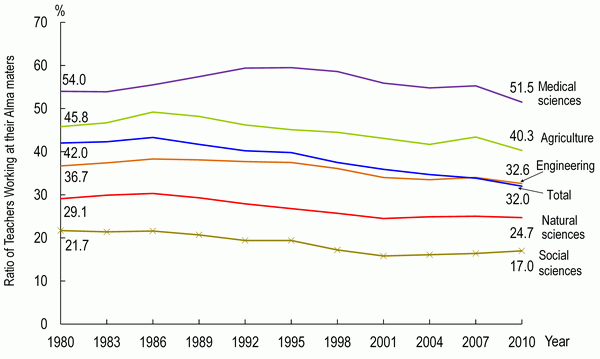
The average ratio of university teachers working at their alma mater in FY 2010 was 32.6% against the total, but is decreasing in the long term. By field of study, the medical sciences field has the largest proportion of teachers working at their alma maters, approximately 50%. The smallest proportion of teachers working at their alma maters is in the social sciences at around 20%.
Over the long term, there has been a declining trend in every field, indicating a decrease in teachers working at their alma maters (Chart 2-2-10 (A)).
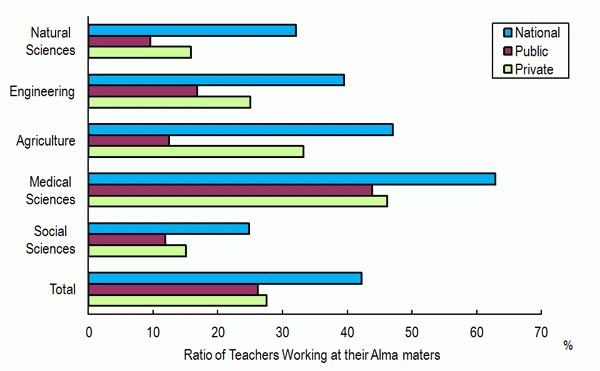
Examined by type of university, the ratio of university teachers working at their alma maters against the total was large in national universities and small in public universities in every specialized field of study. And when examined by field of study, the number of university teachers working at their alma maters accounts for especially large proportion in “medical sciences” in all types of, or national, public and private universities. In the natural sciences, on the other hand, the ratio for such teachers was much higher at national universities. It was only half as high at private universities and a quarter as high at public universities. (Chart 2-2-10 (B)).
(A) Trend of the ratio by specialized field of affiliated university
Note:
The field of “Medical Sciences” includes Medicine.
Resource:
MEXT, “Statistical Survey on School Teachers”
(10)the Defence Evaluation and Research Agency (DERA)
(11)According to the statistics on universities and colleges (MEXT, “Report on School Basic Survey” 2013 version), as of May 01, 2013, the number of regular teachers was 178,669 in faculties of universities combined with graduate schools, 8,631 in junior colleges, and 4,336 in technical colleges, totaling 191,636.

