1.3.3 R&D expenditure in the university and college sector
Key points
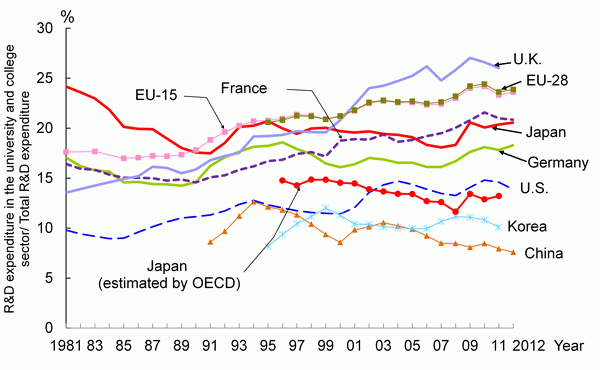
- Japan's R&D expenditure in the universities and colleges sector in FY 2012 was 3.6 trillion yen. This expenditure level has been trending flat in recent years. The value for Japan (estimated by the OECD) was 2.1 trillion yen (2011).
- With regard to the average annual growth rate of R&D expenditure by real value (2005 base, national currency), Japan, the U.S., the U.K. and China showed a lower rise in the second half of the 2000s (2005 through the most recent available year) than in the first half of that decade (2000-2005).
- Looking at the most recent three-year averages for the share of university and college R&D expenditure covered by governments, France is highest while Japan is lowest. Compared with 2004-2006, Korea showed the largest increase, while the U.S. showed the largest decrease.
- As for the most recent three-year average for the share of university and college R&D expenditures borne by businesses in the selected countries, China was well ahead of the other countries. On the other hand, the country with the smallest share is France. In comparison with 2004 to 2006, almost all of the countries showed no change or a decrease; Korea showed the largest decrease.
(1) Researchers in the universities and colleges sector in each country
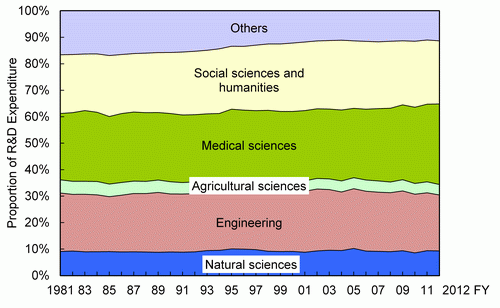
Higher education institutions such as universities, which have a function as R&D institutions, play an important role in R&D systems in every country. As stated in Section 1.1.2, R&D expenditure used in higher education institutions in each selected country accounts for approximately 10% to 30% of the total.
The scope of higher education institutions depends on the country, but in every country the main institutions are universities. The institutions under survey also depend on the country. The summary of targeted institutions is as follows: For Japan, universities (including graduate schools), junior colleges, technical colleges, university research institutes and other institutions were targeted(8). For the U.S., universities & colleges (institutions that perform R&D equivalent to 150,000 dollars or more annually; FFRDCs are excluded) were targeted. For Germany, universities, comprehensive universities, and colleges of theology, etc. were targeted. For France, the National Center for Scientific Research (CNRS), and higher education institutions including universities and Grandes Ecoles not under the jurisdiction of the Ministry of National Education “Ministere de I’ Educationale” ) (MEN) were targeted. In most countries, all fields were covered by the statistics. However, in the U.S., S&E(9) fields were covered, while in Korea, only the field of natural sciences and engineering was included until 2006 (see Chart 1-1-4).
In order to obtain R&D expenditure in the universities and colleges sector, it was necessary to calculate the costs after separating R&D activities from educational activities; however, this separation is generally difficult.
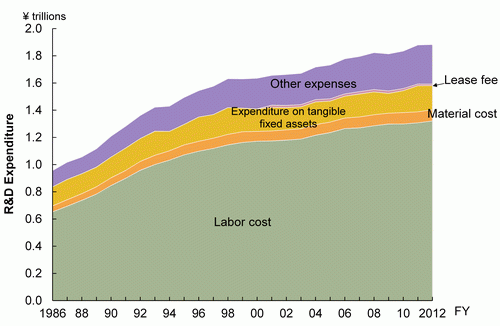
The figures for R&D expenditure in Japan's university and college sector are those according to the “Survey of research and development” compiled by the Ministry of Internal Affairs and Communications. In these surveys, the breakdown of the R&D expenditure includes labor cost. However, the total labor cost is composed of elements including “duties other than research (such as education)” .
Statistics for R&D expenditure in the university and college sector in Japan do not adopt a full-time equivalent, and almost all teachers are measured as researchers. However, it not true that the duties of all teachers are exclusively limited to research. Therefore, it is natural to consider that the situation in which the labor cost of all the teachers is measured as R&D expenditure is an over-estimation with regard to R&D expenditure.
The OECD is also cognizant of this situation, and therefore multiplied labor costs of Japan's R&D expenditure by 0.53 for the period of 1996 (10) to 2001 and by 0.465 for 2002 and subsequent years in the OECD statistics. Adjustment factor 0.465 for the data since 2002 is the Full Time Equivalent coefficient obtained from the “Survey on the Data for full-time equivalents in universities and colleges” in 2002 compiled by the Ministry of Education, Culture, Sports, Science and Technology. This survey was carried out again in 2008. The FTE equivalent coefficient in that survey was 0.362. OECD data from 2008 on use the FTE coefficient from the 2008 survey.
Hereinafter, both these values provided by the OECD (clearly referred to as “Japan (estimated by OECD)” ) and the values provided by the “Report on the Survey of Research and Development” compiled by the Ministry of Internal Affairs and Communications (referred to as “Japan” ) are given.
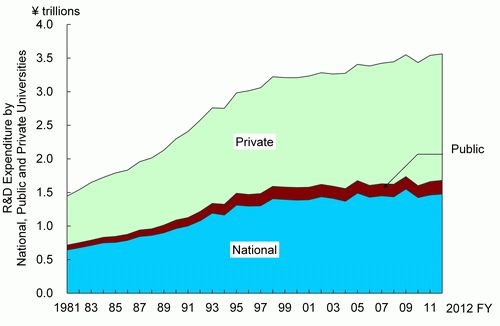
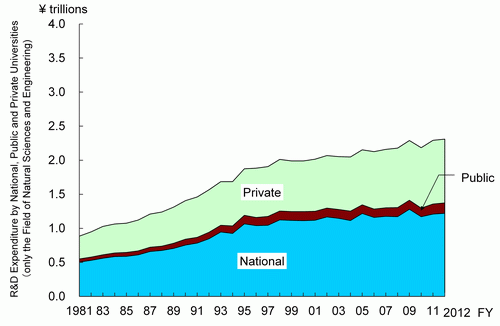
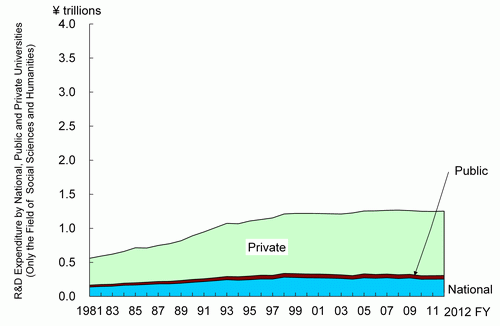
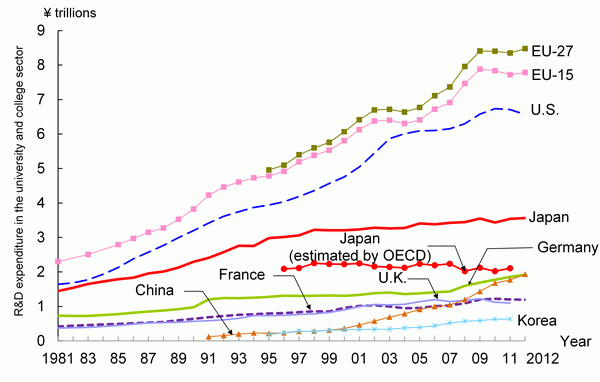
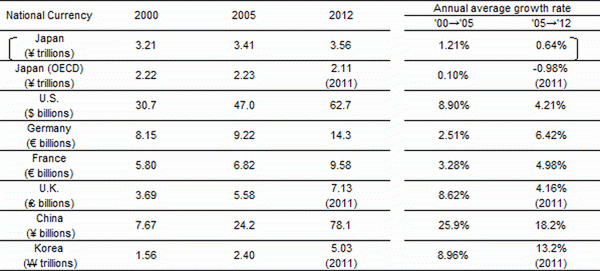
Chart 1-3-13(A) shows the nominal values of R&D expenditure in the university and college sector. Japan's R&D expenditure in the universities and colleges sector in FY 2012 was 3.5624 trillion yen. This expenditure level has been trending flat in recent years. R&D expenditure in the universities and colleges sector for Japan (estimated by the OECD) was 2.1065 trillion yen (2011). With regard to other countries, the U.S. and the EU had seen remarkable increases, but their expenditures have flattened out in recent years. Germany has had an upward trend since the mid-2000s. On the other hand, expenditure in France and the U.K. has stayed roughly the same in recent years. R&D expenditure has steadily increased in China since 2000.
Looking next at the annual average growth rate of each country in terms of national currency (nominal value) (Chart 1-3-13 (B)), countries having higher growth rates in the second half of the 2000s (2005 to the most recent available year) than the first half of the 2000s (2000 to 2005) are Germany, France, and Korea. Japan's rate was largely unchanged in the second half of the 2000s (negative growth in the case of Japan (estimated by OECD)). It should be noted that although China had low R&D expenditure in the second half of the 2000s, it had the highest growth rate at 18.2%.
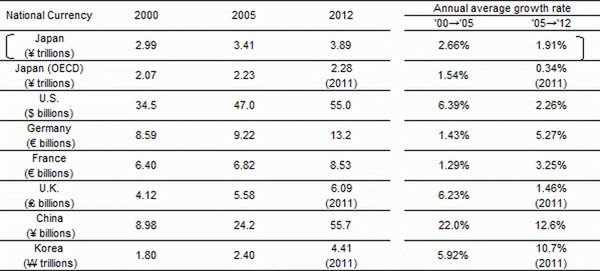
Looking at real values with consideration for prices (Chart 1-3-13(C)), the countries with higher growth rates in the second half of the 2000s than the first half are Germany, France, and Korea. The countries with lower rates are Japan, the U.S., the U.K., and China. Additionally, in the case of China, while the annual average growth rate was originally quite high, it has been declining in a manner similar to nominal values in comparison with the first half of the 2000s.

Note:
1) The definition of the university and college sector is different depending on the country. Therefore, it is necessary to be careful when making international comparisons. Refer to Chart 1-1-4 for the definitions of the university and college sector.
2) The purchasing power parity used here is the same as that in Reference statistics E.
3) R&D expenses include the fields of social science and humanities (for Korea, only natural sciences until 2006)
<Japan (estimated by OECD)> Since 1996, values corrected and estimated by the OECD (Labor cost included in the R&D expenditure for the university and college sector was converted to FTE to obtain the total R&D expenditure).
<Germany> Former West Germany until 1990 and unified Germany since 1991, respectively.
Source:
Same as for Table 1-1-6
The trend of the ratio of R&D expenditure in the universities and colleges sector against the total R&D expenditure for each country is shown in Chart 1-3-14. The ratio of Japan's universities and colleges sector had remained flat in recent years, but in 2012 it rose by 0.2 percentage points compared to the previous year to reach 20.6%.
Looking at the other countries, the U.K. is showing an increasing trend, particularly since 2000. Although this is partially due to increasing R&D expenditure in U.K. universities, it is also thought to be a result of low R&D expenditure growth in the public sector. Over the long term, the U.S. and Germany have had fluctuating ratios; however, both are showing increasing trends in recent years. On the other hand, China and Korea are remaining flat in terms of their ratios. This is thought to be because of significant growth throughout their total R&D expenditures.
Note:
Same as for Chart 1-1-1 and Chart 1-1-6.
Source:
Same as for Chart 1-1-1 and Chart 1-1-6
(2) Structure of source of funds for R&D expenditure in the universities and colleges sector in selected countries
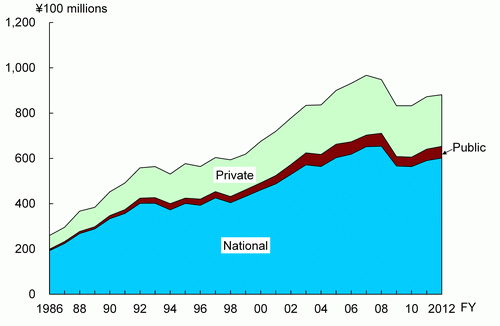
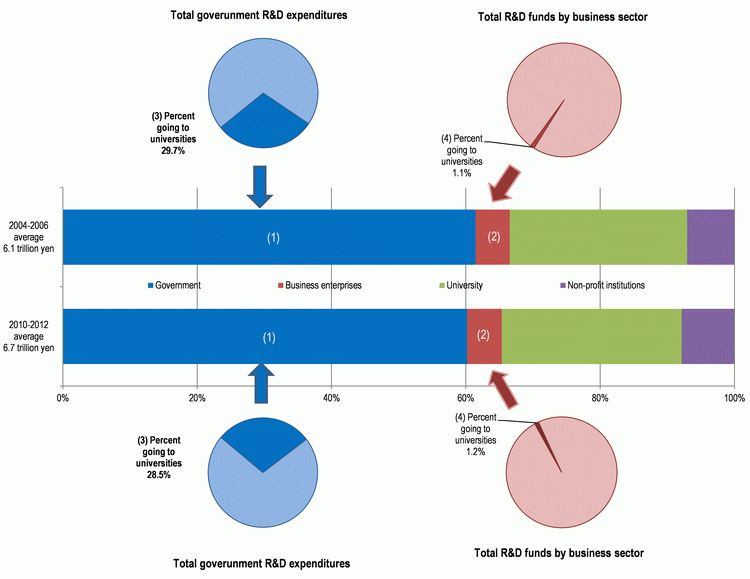
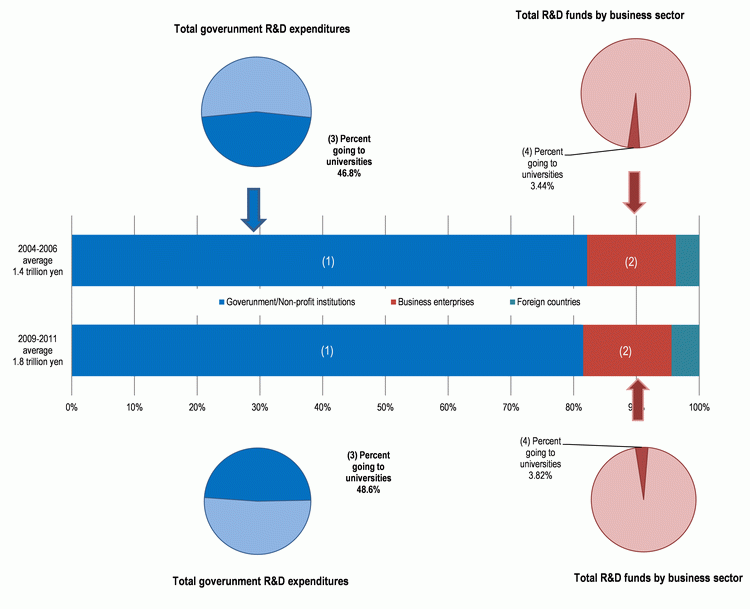
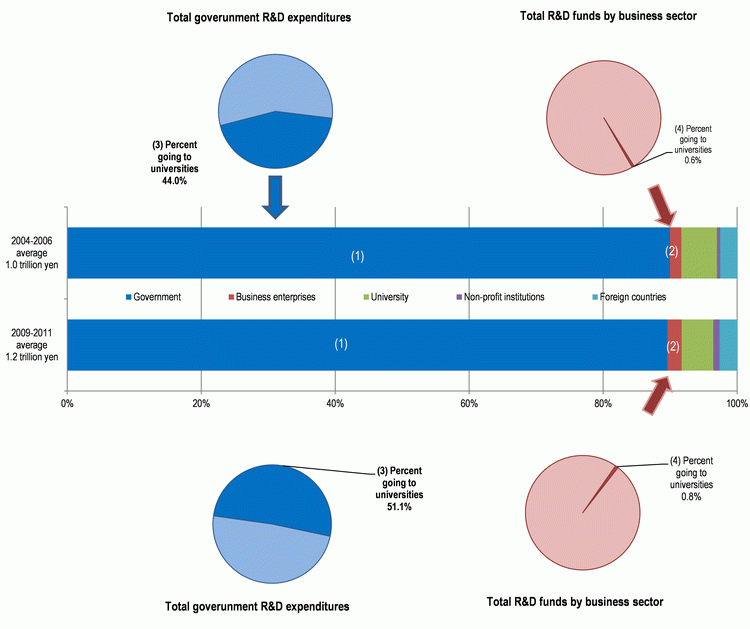
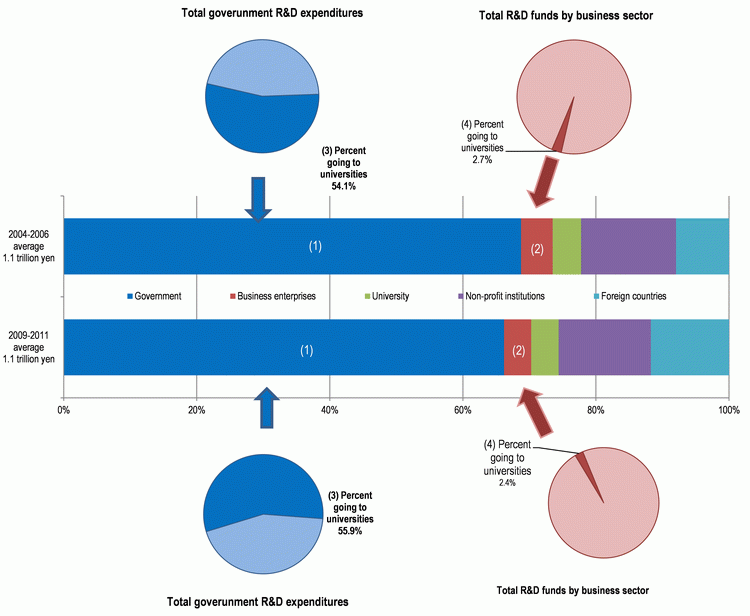
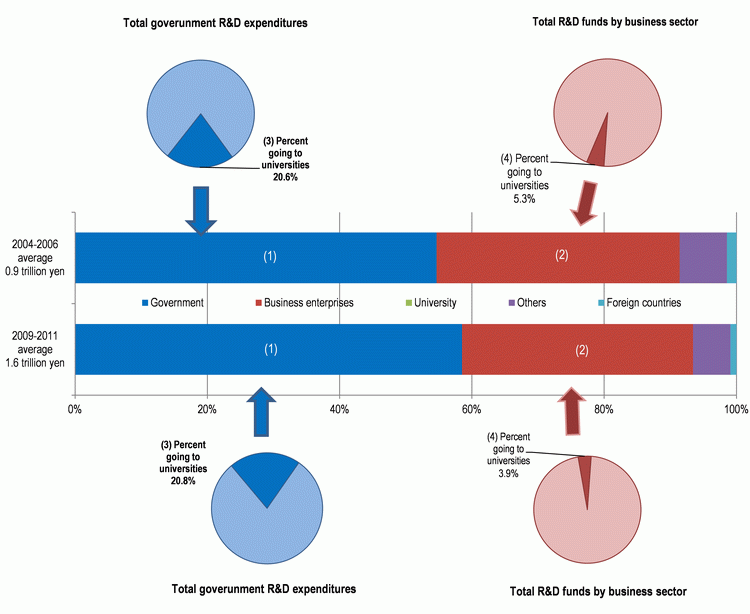
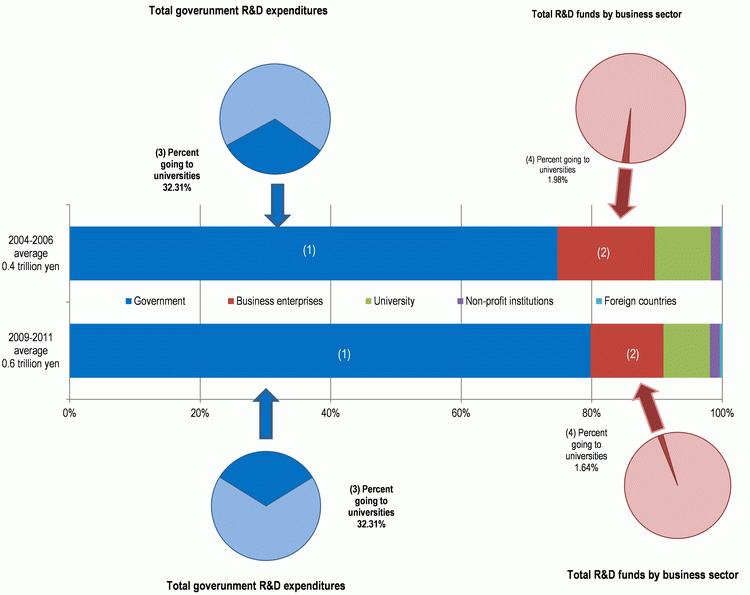
Chart 1-3-15 shows a breakdown of the percentages of the costs of intramural universities and colleges R&D expenditures borne by various sectors in selected countries. In other words, of universities and colleges R&D expenditures used intramurally, it shows how much of the burden of research funding is borne by different sectors. It also shows what percentages of funds borne by government and the business enterprise sector are accounted for by funding provided to universities and colleges.
Looking first at the most recent three-year average for the share of university and college R&D expenditure covered by different sectors (Charts 1-13-15 (A), (i), (ii)), the country with the highest government funding share in terms of the most recent three-year average is France; the country with the smallest is Japan. Compared with 2004-2006, Korea showed the largest increase, while the U.S. showed the largest decrease.
Looking at the share of business enterprises, the country with the largest share in terms of the most recent three-year average is China by a wide margin. On the other hand, the country with the smallest share is France. In comparison with 2004 to 2006, almost all of the countries showed no change or a decrease; Korea showed the largest decrease.
By country, during 2010-2012 the share of costs borne by the Japanese government was 48.9%, while that borne by business enterprises was 2.5%. Compared with 2004-2006, the government share decreased by 0.9 percentage points, while the business enterprise share decreased by 0.3 percentage points.
In the U.S., the government's share of the cost for all universities and colleges was 60.2% during 2010-2012, while the business enterprise sector's share was 5.2%. This was a 1.3 percentage point decrease for government and a 0.1 percentage point increase for business compared with 2004-2006.
In Germany, government and non-profit institution bear large percentages of the costs. In 2009-2011, they accounted for 81.5% of the whole. The business enterprise sector also accounts for a large share relative to the other countries at 14.1%. Compared with 2004-2006, the government share decreased by 0.6 percentage points, while the business enterprise share decreased by 0.1 percentage points.
The government's share in France is also large. During 2009-2011, it accounted for 89.6%, the largest share of any of the selected countries. On the other hand, the business enterprise sector's share was only 2.1%, the smallest of any of the selected countries. Compared with 2004-2006, the government share decreased by 0.4 percentage points, while the business enterprise share increased by 0.4 percentage points.
In the U.K., the government share was 66.2% for 2009-2011. The business enterprise sector's share was 4.1%. Compared with 2004-2006, the government share decreased by 2.5 percentage points, and the business enterprise share decreased by 0.7 percentage points.
In China, the government share was 58.5% for 2009-2011. On the other hand, the share borne by business enterprises was 34.9%, the highest among the selected countries. Compared with 2004-2006, the government share increased by 3.8 percentage points, while the business enterprise share decreased by 1.8 percentage points.
In Korea, the government share was 79.8 for 2009-2011, while the business enterprise share was 11.2%. Compared with 2004-2006, the government share increased by 5.1 percentage points, which is a high rate of increase compared to the other countries. In contrast, the business enterprise share fell by 3.8 percentage points, which is a number compared to the other countries.
Next, the percentage of R&D expenditure by the government and business enterprise sectors that goes to universities and colleges is examined (Chart 1-3-15 (A), (iii), (iv)).
The largest share of government R&D expenditures that go to the universities and colleges sector is 55.9%, in the U.K. Likewise, roughly half (approximately 50%) go to this sector in Japan, Germany, and France. About 30% goes to universities and colleges in the U.S. and Korea. China has the smallest percentage, at 20.8%.
Only a small percentage of the business enterprise sector's R&D expenditures go to universities and colleges in any of the selected countries. China and Germany have relatively large percentages at about 4.0%. In contrast, Japan, the U.S. and France are around 1%.
Comparing 2004-2006 to the most recent available year, France had the largest increase in the share of government R&D expenditure that went to universities and colleges, posting a 7.1 percentage point increase. On the other hand, there was little if any growth from the business enterprise sector in any country.
As shown in Charts 1-3-15 (B)-(G), the share borne by foreign countries was small in all of the countries. However, this share is comparatively large in the U.K., standing at 11.7%. Compared with 2004 to 2006, this share has increased by 3.8 percentage points.
(A) Table
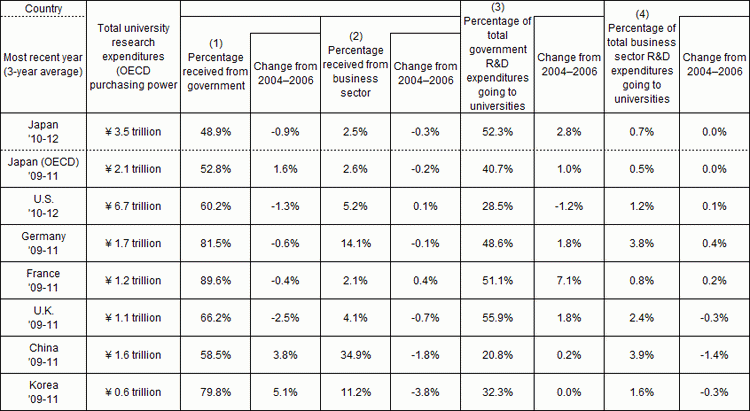
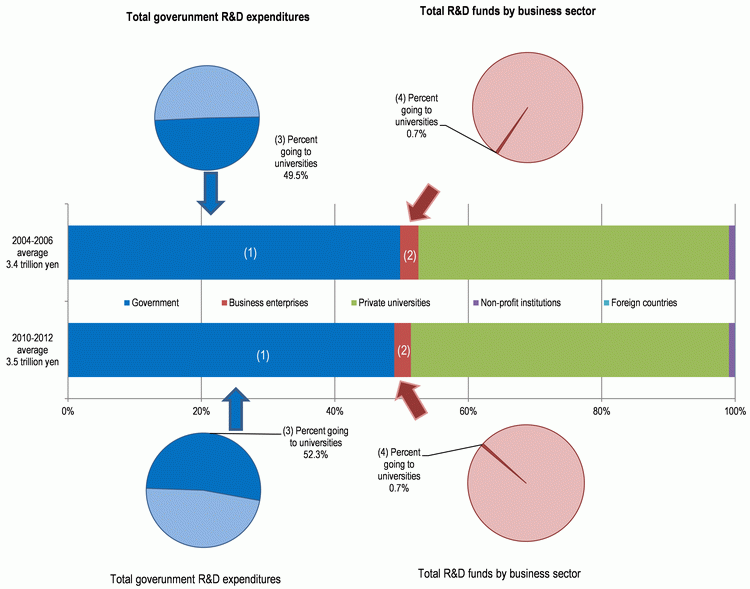

For the Japanese statistics, of R&D expenditures used at universities and colleges, the share of costs borne by universities and colleges refers to funding by private universities and colleges. Most of that is R&D expenditures self-funded by the private universities and colleges.
Notes:
1) Three-year averages used. For example, 2010-2012 refers to the average value for the years 2010 through 2012.
2) Numbers by the arrows refer to the percentage of funds from each sector's R&D expenditures going to the universities and colleges sector. For example, during FY 2010-2012 in Japan, of costs borne by government, 52.3% went to universities and colleges.
3) Other notes, regarding international comparison, etc., are as for Charts 1-2-3 and 1-2-4.
4) The 2012 values for the U.S. are preliminary.
Source:
Same as for Chart 1-2-4.
(3) Funding structure for universities and colleges R&D expenditures by form of institution in Japan and the U.S.
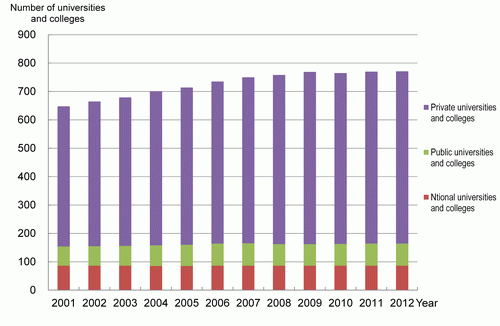
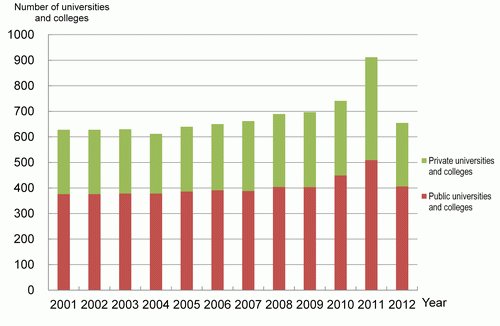
Chart 1-3-16 shows changes in the number of universities and colleges in Japan and the U.S. covered by R&D statistics. The U.S. (NSF) does not cover all universities and colleges. It covers only universities and colleges with annual R&D budgets of at least 150,000 dollars. While Japan's Survey of Research and Development, in contrast, includes junior colleges, for the sake of comparison between Japan and the U.S., only four-year universities and colleges will be discussed here.
In the most recent year available, Japan had 86 national universities, 78 public universities and 607 private universities. Looking at trends, the number of private universities was increasing but has flattened out in recent years.
In the most recent year available for the U.S., there were 406 state universities and 249 private universities.
Note:
There are differences in the scope covered by universities in Japan and the U.S., so caution is needed when making international comparisons. In Japan's case, they are four-year schools. Junior colleges, joint-use institutions, etc., are not included. In the case of the U.S., they are institutions utilizing annual research budgets of at least 150,000 dollars.
Sources:
<Japan> Recalculated by NISTEP from individual data in Ministry of Internal Affairs and Communications, “Report on Survey of Research and Development”
<U.S.> NSF.“Higher Education Research and Development,” “Academic Research and Development Expenditures”
Next, the funding structures of universities and colleges in Japan and the U.S. and changes therein will be examined.
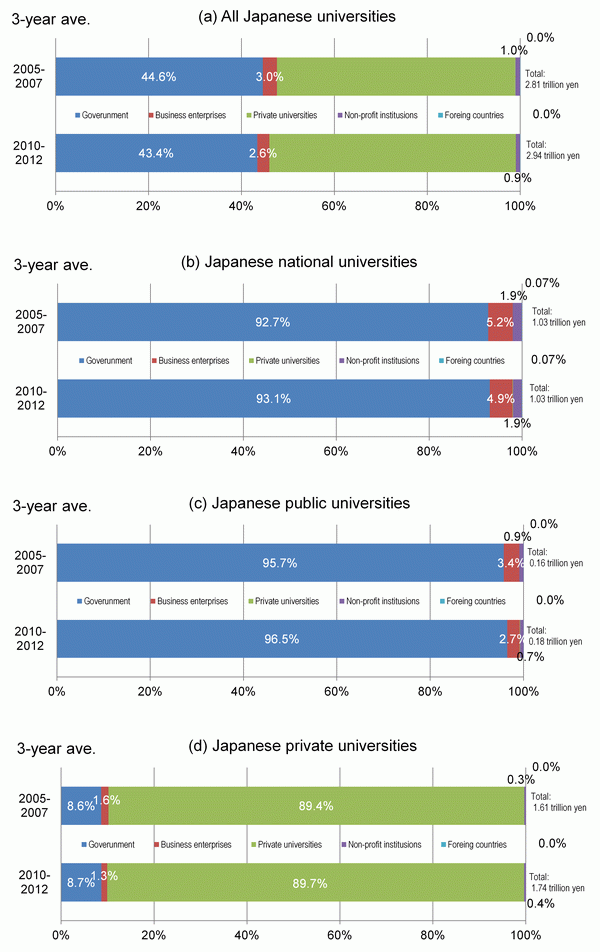
Chart 1-3-17 (A) shows the funding structures for Japanese universities (four-year universities) according to type, i.e., national, public and private universities. For all universities, 40% of funding comes from government and 50% comes from private universities. Little funding comes from the business enterprises or other sectors.
Looking at the share for national universities in 2010-2012, 93.1% of funding came from government. This figure is almost unchanged in comparison with that for 2005-2007. The share of funding from business enterprises was small (4.9%) and decreasing. A similar trend is seen for public universities. As for private universities in 2010-2012, 89.7% of funding for R&D expenditures came from private universities, indicating that their R&D is mostly self-funded. Funds from government accounted for 8.7% during 2010-2012, which is unchanged from 2005-2007. The share of funds from business enterprises was extremely small at 1.3%.
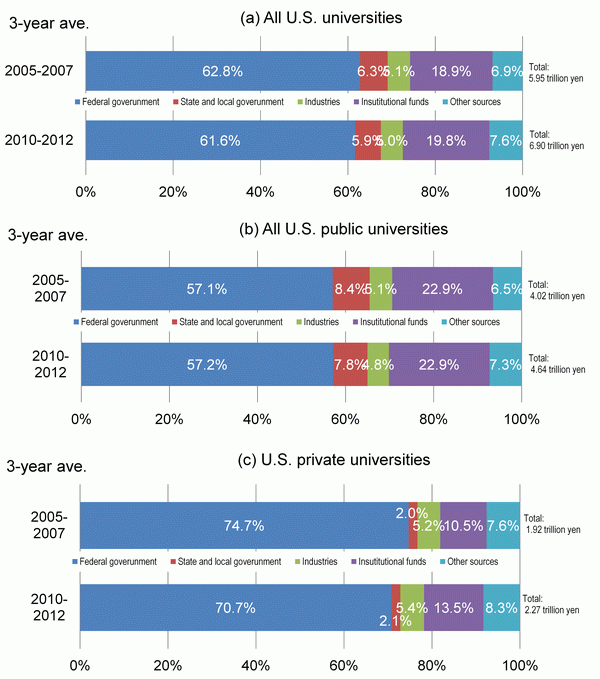
Chart 1-3-17 (B) shows the R&D expenditure funding structure of U.S. universities and colleges divided into public and private universities and colleges. For all universities, approximately 70% of funding comes from the federal government or state and regional governments, while approximately 20% are institutional funds (funds of unspecified purpose that come from business enterprises, foundations, and other outside funding sources; includes indirect costs of projects).
A comparison of state universities and private universities in 2010 to 2012 shows that the share of funds from the federal government and state and regional governments is larger for private universities (72.8%) than state universities (65.0%). Conversely, the share of institutional funds is larger for state universities (22.9%) than private universities (13.5%).
(A) Japan
Note:
See Chart 1-3-15 for caution on international comparison.
<U.S.>
1) Institutional funds are funds of unspecified purpose that come from business enterprises, foundations, and other outside funding sources. This includes indirect costs of projects.
2) Other funding refers to other unclassified sources. It includes, for example, funds donated by individuals for research use. Data from “non-profit institutions” were obtained from 2010.
Sources :
<Japan> Recalculated by NISTEP from individual data in Ministry of Internal Affairs and Communications, “Report on Survey of Research and Development”
<U.S.> Up to 2009: NSF, “Academic R&D Expenditures” ; from 2010: NSF, “Higher Education Research and Development”
(4) Comparison of share of R&D expenditures in total operating costs at Japanese and U.S. universities and colleges
The shares of total operating costs (total expenditures) at Japanese and U.S. universities and colleges accounted for by R&D expenditures were compared. Three-year averages from 2010 through 2012 at degree-granting four-year universities and colleges in Japan and the U.S. were used.
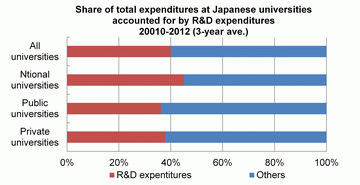
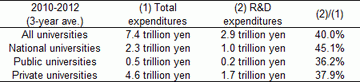
In Japan's case, data on total expenditures and R&D expenditures from R&D statistics by the Ministry of Internal Affairs and Communications were used. Looking at Chart 1-3-18, R&D expenditures accounted for 40.0% of total expenditures at all universities. By type of university, the highest share was at national universities with 45.1%. Public universities had a share of 36.2% and private universities of 37.9%.
Note:
Four-year universities and colleges. Junior colleges and university joint-use facilities, etc., are not included. Statistical reference E was used for purchasing power parity conversion.
Source:
Ministry of Internal Affairs and Communications, “Report on the Survey of Research and Development”
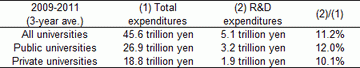
In the case of the U.S., the NSF's R&D statistics do not include total operating costs (total expenditures) at universities and colleges, so National Center for Education Statistics (NCES) IPEDS data was used. IPEDS is a database on postsecondary education (including higher education) in the U.S. It has data on total expenditures and research expenditures, so those figures were used for comparison with Japan. Research-related budget items that cannot be clearly differentiated from instructional or other purposes are counted as instruction expenditures by IPEDS. This results in the underestimation of research expenditures. In addition, IPEDS also includes “academic support,” including running costs of computer center and library, as a category. Some research-related expenditures may be included in that category as well. IPEDS statistics for research expenditures and other categories include salaries and wages, so personnel costs are included in the figures.
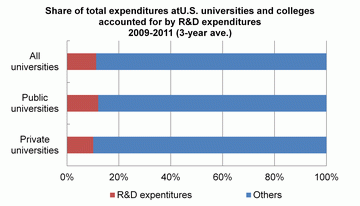
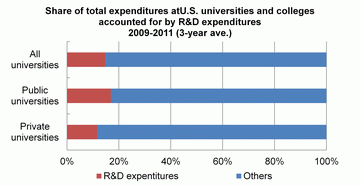
Looking at Chart 1-3-19, the share of all expenditures accounted for by research at all universities and colleges was 11.2%. At public universities and colleges, it was 12.0%, and at private universities and colleges, it was 10.1%.
Comparing Japan and the U.S., R&D expenditures account for 40% of total operating costs at Japanese universities and 10% at U.S. universities and colleges. In both Japan and the U.S., R&D expenditures account for higher shares at public universities. R&D at Japanese national universities accounts for about four times as large a share as it does at U.S. public universities and colleges.
Note:
These are four-year universities and colleges (four-year institutions). In the case of some for-profit private universities and colleges, figures for public service are included in the calculation of research expenditures. However, these figures account for only about 0.03% of research expenses at all private universities and colleges. Statistical reference E was used for purchasing power parity conversion.
Sources:
NCES, IPEDS, “Digest of Education Statistics”
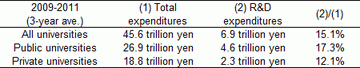
Next, U.S. universities' R&D expenditures according to the NSF will be used for comparison in place of IPEDS research expenditures.
The NSF's R&D statistics cover universities and colleges with annual R&D expenditures of at least 150,000 dollars. There are 912 such universities and colleges in the U.S. (as of 2011). The NSF total is still about 2 trillion yen higher than for IPEDS’ research expenditures, which cover about 2,962 universities and colleges (including about 682 public universities and colleges) (as of 2012). As noted above, this must be because IPEDS’ research expenditures are underestimated. Furthermore, because the universities and colleges that the NSF does not include each have R&D expenditures of less than 150,000, their total contribution is small. A comparison between the NSF's R&D expenditures and IPEDS’ total expenditures therefore seems rational.
Looking at Chart 1-3-20, R&D expenditures accounted for 15.1% of total expenditures at all universities. By type of institution, the share is 17.3% at public universities and colleges and 12.1% at private universities and colleges.
The NSF's survey was conducted under the condition that the R&D expenditure category does not include anything that cannot be differentiated from categories such as instruction.
Note:
These are four-year universities and colleges (four-year institutions). Statistical reference E was used for purchasing power parity conversion.
Sources:
Total expenditures: NCES, IPEDS, “Digest of Education Statistics”
R&D expenditure: Up to 2009: NSF, “Academic R&D Expenditures” ;
from 2010: NSF, “Higher Education Research and Development”
In the case of Japanese universities, R&D expenditures are overestimated because they often include personnel costs for researchers (faculty, medical staff and other researchers) without regard to the percentage of time they spend on research. Using the OECD's R&D expenditures that corrects labor costs by adjusting them by the percentage of time devoted to research reduces the figure by about 40%. Even so, R&D expenditures account for about 30% of total expenditures.
Even with these attempted corrections, there are large differences related to total operating costs and R&D expenditures in Japanese and U.S. universities and colleges. There are still points that need to be examined in order to carry out a proper comparison of R&D expenditures in Japanese and U.S. universities and colleges (Chart 1-3-21).