1.4 R&D expenditure by type of R&D
Key points
- The expression R&D expenditure by type of R&D is a classification of R&D expenditure into that for basic research, applied research, and development. In Japan, however, this classification has been made only for the field of natural sciences and engineering.
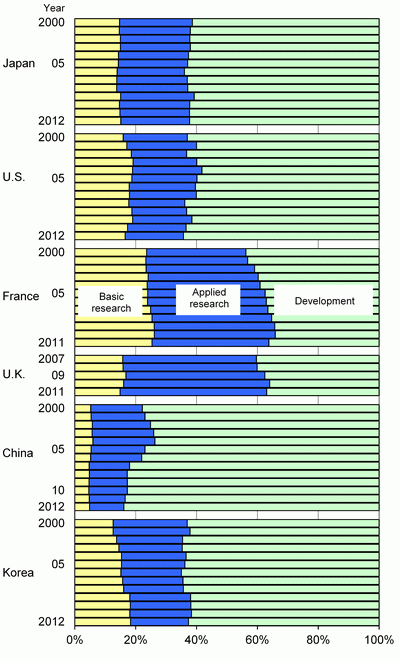
- Out of R&D expenditure in FY 2012 for Japan, the proportion of that for basic research was 15.1%. Moreover, looking at R&D expenditure by type of R&D for the most recent available year of each country, the country with the largest basic research share is France, where basic research accounts for 24.4% of the total. On the other hand, the country with the smallest basic research share is China, where it accounts for 4.8% of the total.
- Looking at R&D expenditure by type of R&D, France had the largest share allocated to basic research among the countries, the U.K. had the largest share allocated to applied research, and China had the largest share allocated to development.
1.4.1 R&D expenditure by type of R&D
The expression R&D expenditure by type of R&D represents the intramural R&D expenditure roughly classified into that for basic research, applied research and development. This classification is in accordance with the definition in the “Frascati Manual” by the OECD which each country has adopted. Therefore, the influence caused by responders’ subjective estimates should be taken into account. The summary of the definition of characters of work in the “Frascati Manual” is as follows.
Basic research is exploratory and theoretical work mainly in order to obtain new knowledge on the causes behind phenomena and observable facts without considering any specific application or use.
Applied research is also an original exploration in order to obtain new knowledge. It is, however, mainly for certain actual purposes or objectives.
(Experimental) development is systematic work in which existing knowledge obtained by research or actual experiments is applied, for the purpose of producing new materials, products and devices, introducing new procedures, systems and services, or practically revising what has already been produced or introduced.
Each country seems to measure the data in accordance with the definition above, but the expressions used are somewhat different depending on country. For example, “experimental development” is expressed as “development” in the U.S. but as “development experimental” in France, explicitly including experimental work.
Germany has not publicly announced precise data for R&D expenditure by type of R&D, and does not have any such data for the university and college sector. But measured data for R&D expenditure by type of R&D in the business enterprise sector has been published since 2001 (through the data of OECD).
Moreover, measured data for R&D expenditure by type of R&D for the U.K. has published since 2007 (through the data of OECD).
It should be noted that measurement of Japan's R&D expenditures by type of R&D (11) targets only the field of natural science and engineering, not total R&D expenditures. The same was true of Korea through 2006, but since 2007, all fields have been covered.
Chart 1-4-1 shows the proportion of development by type of R&D. France had the largest share allocated to basic research among the countries, the U.K. had the largest share allocated to applied research, and China had the largest share allocated to development.
Out of R&D expenditure in FY 2012(12) for Japan, the proportion of that for basic research was 15.1%, while applied research accounted for 22.6% and development for 62.3%. These proportions have not changed significantly when viewed over the long term.
In the U.S., the proportions of basic research, applied research, and development resemble those of Japan; however the proportion of basic research has been decreasing in recent years.
In France, basic research accounts for the largest share among the countries at 24.4% for the most recent available year. The ratio of development, on the other hand, has been declining. Additionally, the ratios of basic research and applied research are increasing, while that of development is decreasing.
In the U.K., applied research accounts for the largest share, and this share is growing. In the latest available year, applied research accounted for 48.2%, or roughly half of the total. Basic research had a 14.9% share and development a 37.0% share.
China had the smallest share in terms of basic research at 4.8%. However, development had a large share of 83.9%, which was the largest percentage among the countries. Development's share is continuing to grow.
In Korea, the percentage accounted for by basic research has been growing since 2000. Additionally, the percentage allocated to applied research had been decreasing; however, in recent years the percentages for basic research, applied research, and development have all remained unchanged.

Note:
In Japan (and Korea until 2006), R&D expenditure covers only the field of natural sciences and engineering. But R&D expenditure in other countries is the total of that for the field of natural sciences and engineering and for social sciences and humanities. Therefore it is necessary to be careful when an international comparison is being made.
<Japan> Fiscal year is used as a year scale.
<U.S.> The 2012 values are preliminary.
<U.K.> Values are national projections or estimated values.
Sources:
<Japan> Ministry of Internal Affairs and Communications, “Report on the Survey of Research and Development”
<U.S.> NSF, “National Patterns of R&D Resources: 2011-12 Data Update”
<Germany, France, U.K., and China> OECD, “Research & Development Statistics 2013”
<Korea> National Science and Technology Information Service (website)
1.4.2 Basic research in each country
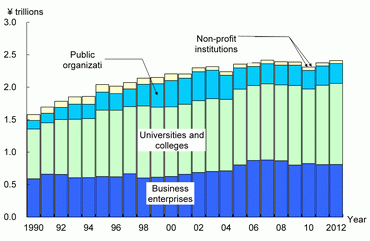
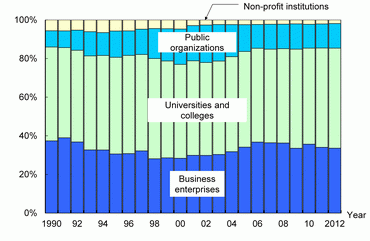
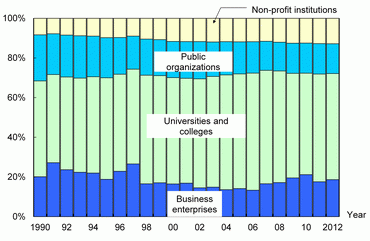
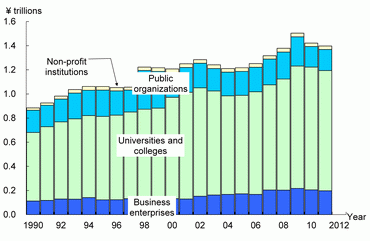
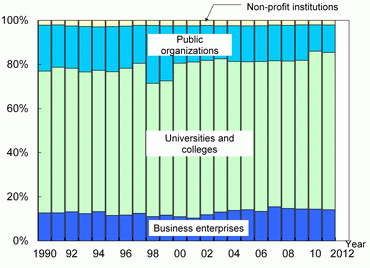
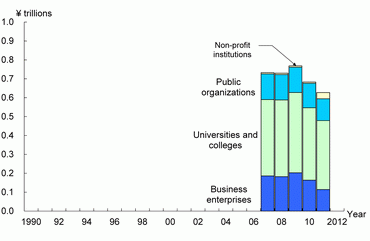
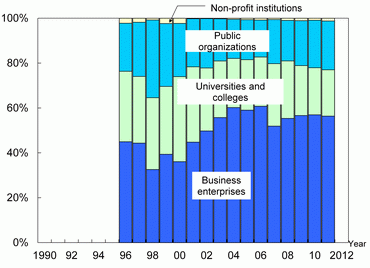
Next, we examine which sector is in charge of basic research in each country. Basic research provides low return on investment over the short term, but it builds intellectual capital in science and technology and is important in constructing foundations for the future. Looking at the trend of the proportion of basic research expenditure by performing sector (Chart 1-4-2), the universities and colleges sector accounts for a large percentage in almost all the selected countries.
In 2012, Japan's basic research expenditure was 2.4 trillion yen, of which the universities and colleges sector accounted for 51.8%. The business enterprises sector's share was also comparatively large.
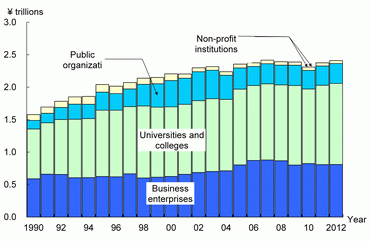
In the U.S., basic research expenditure for the most recent available year amounted to 7.8 trillion yen, of which the universities and colleges sector had the largest share with 53.5%. The non-profit institutions sector in the U.S. had a 12.9% share, and this figure is continuing to grow.
In the latest available year, France's basic research expenditure was 1.4 trillion yen, of which the universities and colleges sector has a rather large percentage compared to other countries of 71.3%. Little change is seen among the ratios of each sector. The variation seen in the 1998 and 1999 figures for the public organizations sector are due to changes in the method of estimation and questionnaire. Data for this period should be considered to have little continuity with other data.
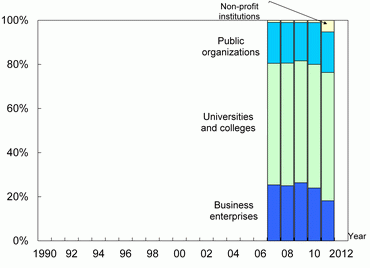
In the latest available year, the U.K.'s basic research expenditure was 62.7 billion yen, of which the universities and colleges sector had the largest share, accounting for 58.2%.
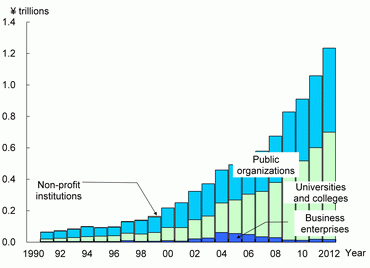
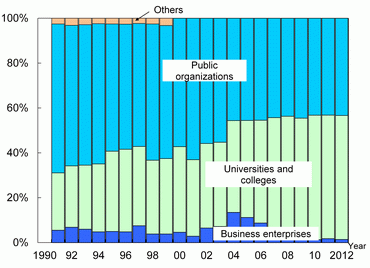
In the case of China, the public organizations sector previously had a large share; however the universities and colleges sector's share has been growing in recent years. On the other hand, the business enterprises sector's ratio is small, indicating that almost no basic research is taking place in this sector.
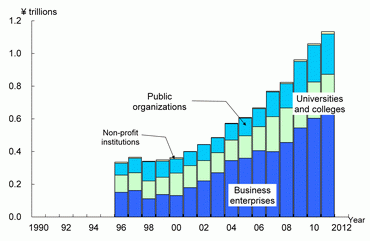
In Korea, a rapid increase in basic research expenditure that began in 2000 is apparent. This expenditure reached 1.1 trillion yen in the most recent available year. It should be noted that the business enterprises sector is the main sector conducting basic research in Korea. This sector posted a 56.4% share in the most recent available year.

| Country | Expenditure (Yen PPP) | Proportion of expenditure by sector |
| (A) Japan |
 |
 |
| (B) U.S |
 |
 |
| (C) France |
 |
 |
| (D) U.K |
 |
 |
| (E) China |
 |
 |
| (F) Korea |
 |
 |
Note:
1) In Japan (and Korea until 2006), R&D expenditure covers only the field of natural sciences and engineering. But R&D expenditure in other countries is the total of the field of natural sciences and engineering and of social sciences and humanities. Therefore it is necessary to be careful when international comparisons are made.
2) Purchasing power parity equivalent is the same as for Reference statistics E.
3) All values for the U.K. are national projections or estimated values.
Sources:
<Japan> Ministry of Internal Affairs and Communications, “Report on the Survey of Research and Development”
<U.S.> NSF, “National Patterns of R&D Resources: 2011-12 Data Update”
<France, U.K., China, and Korea> OECD, “Research & Development Statistics 2013”
Column: An international comparison of changes in R&D expenditure
Data charting changes in R&D expenditure over a fixed period provide useful indicators for ascertaining R&D trends. At the same time, appropriately grasping changes in R&D expenditure, which serve as an indicator for the R&D input side, is important for understanding the trends of output indicators.
Many of the charts appearing in Chapter 1 show changes in various R&D expenditures. However, when making international comparisons, purchasing power parity is used for the purpose of currency conversion, and this conversion can be influenced by changes in parity. Thus, purchasing power parity is inappropriate for detailed examination of changes in R&D expenditure. Given this, the following is an attempt to make international comparisons of recent changes in R&D expenditure by setting the monetary amount of R&D expenditure of each country in 2000 as an index number of 100, rather than using currency conversion.
This kind of index will be able to serve as an indicator that better reflects fundamental changes in R&D expenditure if real values that exclude the effects of price fluctuations can be prepared. However, because no R&D expenditure deflator that is based on a commonly accepted method among countries exists, the author has prepared an index for nominal values only. Nominal values have the advantage of matching with actual perceptions.
It should be noted that, when preparing charts showing the data of each country, the author decided in the cases of China and Korea to provide only index numbers for the latest available year, as the numbers for these countries demonstrate much greater movement than those of the other selected countries.
(1) Total R&D expenditures
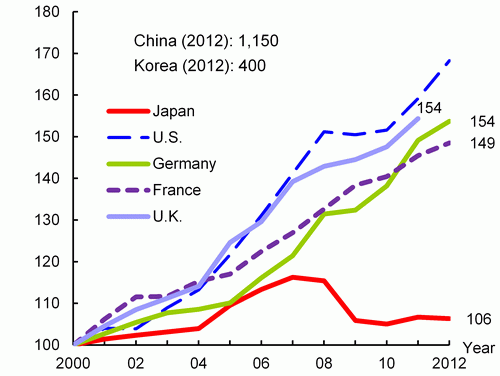
A comparison of changes in the total R&D expenditures of the selected countries that sets the 2000 amount as an index number of “100” reveals that Japan has had the smallest increase among the countries since 2000 (Chart 1-5-1).
Looking at index numbers for the latest available year, in contrast to Japan's 106 for 2012, the number of the U.S. was 168, while those of Germany, France, and the U.K. were near 150. This means that the R&D expenditures of these countries increased by approximately 1.5 times during these 10 years. Moreover, Korea had a four-fold increase and China had a more than ten-fold increase during this same period.
Source:
Same as for Chart 1-1-1
(2) GBAORD
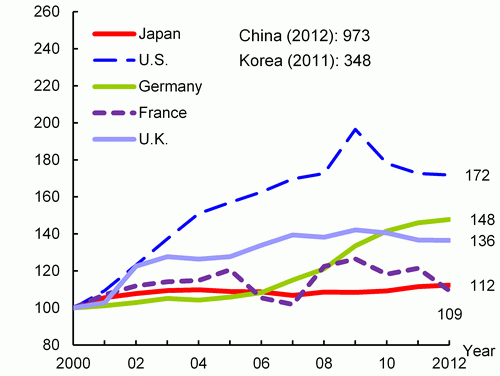
Next, a comparison of changes in GBAORD in each country using the numbers shows that, outside of China and Korea, the U.S. has had conspicuous long-term growth. The U.S.'s number for 2012 was 172 (Chart 1-5-2). It should be noted that the U.S.'s index number for 2009 is relatively high compared to prior and subsequent years. This is largely the result of economy-boosting budgetary measures that were taken based on the American Recovery and Reinvestment Act of 2009 in response to the Lehman Brothers’ bankruptcy-sparked economic crisis. Japan's number has remained unchanged overall. Its index number for 2012 was 112, which ranked it with France at the low end among the selected countries.
Source:
Same as for Chart 1-2-1.
(3) R&D expenditure in the universities and colleges sector
Properly grasping changes in R&D expenditure in the universities and colleges sector is important when considering factors behind changes in qualitative and quantitative data on scientific research papers, which provide a major indicator of R&D output. This is because the universities and colleges sector forms the core of research paper production in almost all countries, including Japan.
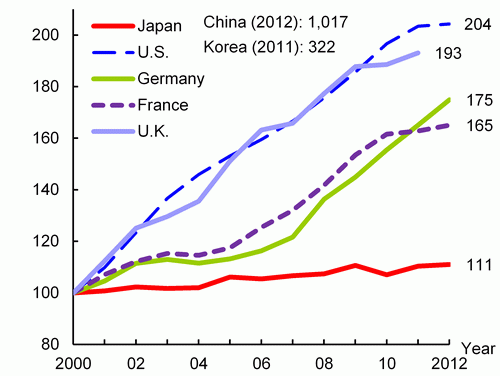
A look at the trends of R&D expenditure in the university and colleges sector (Chart 1-5-3) reveals that only Japan is showing slight increases. Japan's index number for 2012 is 111, which is the lowest among the countries shown in the chart. Looking at the index numbers for the most recent available year of the other countries, the U.S. (204) and U.K. (193) posted numbers that were roughly twice their 2000 levels. Germany (175) and France (165) also had much higher numbers compared to Japan.
Source:
Same as for Chart 1-3-13.
(4) Summary
What characteristics can be identified for Japan and the other selected countries based on a comprehensive view of the above-mentioned data?
For Japan, it is apparent that all of its index numbers have shown smaller growth than the other countries. In particular, growth in R&D expenditure in Japan's universities and colleges sector has been especially small in comparison with the other countries. Moreover, even though major European countries have similarly small growth in terms of their governments’ S&T-related budgets, only Japan has had slow R&D expenditure growth in the universities and colleges sector. This is the pattern that characterizes Japan during this 10-year period.
As for the other selected countries, unlike Japan, they display the shared characteristic of having large increases in R&D expenditure in their universities and colleges sectors. Particularly in the cases of Germany, France, and the U.K., R&D expenditure in the universities and colleges sector is showing solid growth despite slow growth in their GBAORD. Moreover, the fact that this sector shows large increases when compared to total national R&D expenditure indicates that universities and colleges are gaining greater importance in these countries’ R&D.
Like Germany, France, and the U.K., the U.S. is also seeing large growth in R&D expenditure in the universities and colleges sector in comparison to national R&D expenditure. However, in the case of the U.S., its GBAORD is showing large growth that exceeds that of its national R&D expenditure.
China and Korea are showing remarkable growth in all of their index numbers. However, the growth rates of their GBAORD and R&D expenditure in the universities and colleges sectors are relatively small compared to their national R&D expenditure. This indicates that their R&D expenditure in the industrial sector, which is not shown in the charts of this column, is particularly large.
(Hiroyuki Tomizawa)
(11) The definition of R&D expenditure by type of R&D in Japan's survey of R&D expenditure, the “Survey of Research and Development,” is as follows; only the field of natural science and engineering is covered.
Basic research: theoretical or experimental research in order to create hypotheses and theories or to obtain new knowledge on phenomena or observable facts, without considering a certain application or use.
Applied research: research to determine the potential of the practical use of knowledge which was discovered by basic research in order to achieve certain objectives; research to explore additional application methods with regard to methods which are already in practical use.
Development: research to introduce new materials, devices, products, systems, procedures, etc. and to revise those which already exist, by using basic research, applied research and knowledge obtained by actual experience.
(12) This section uses "years" for international comparison, although in the case of Japan, it is originally "fiscal years."

