1.3.2 R&D expenditure in the business enterprise sector
Key points
- Japan's R&D expenditure in the public organization sector in FY 2012 was 12.2 trillion yen. The expenditure level has been trending flat since seeing a significant decrease in 2009.
- Looking at ratios of R&D expenditure to GDP in the business enterprises sector of the selected countries, Japan's ratio in 2012 was 2.58%. Although Japan had been ranked at the top here beginning in 1990, Korea has surpassed it since 2009. It should be noted that Korea's ratio in 2011 was fairly high at 3.09%.
- A look at "direct support (amount of business enterprises' R&D expenditures borne by the government)" and "indirect support (amount of business enterprises' corporate taxes to be paid to the government that is exempted through R&D tax incentives)" on a ratio to GDP basis in order to view government support for business enterprises' R&D shows that the share of indirect support is larger in Japan.
- Looking at other countries, those in which direct government support to business enterprises is large include Russia, Slovenia and the U.S. Countries in which indirect support is large include France, Canada, and Belgium.
- The year-on-year R&D expenditure and sales growth rates of Japanese business enterprises show a roughly linked trend. In 2009, the year in which the global economic crisis (called the "Lehman Shock" in Japan) affected Japanese business enterprises, R&D expenditure and the year-on-year sales growth rate were on the negative side by a large margin. However, the ratio of R&D expenditure to sales, which is an indicator showing the degree of focus that business enterprises place on R&D, has remained at a high level since 2009. It is therefore thought that business enterprises are continuing to emphasize R&D.
(1) R&D expenditure in the business enterprise sector for each country
R&D expenditure in the business enterprise sector accounts for the dominant proportion of the total R&D expenditure of each country. Accordingly, fluctuations in the amount in the business enterprise sector have a significant influence on a country's R&D expenditure.
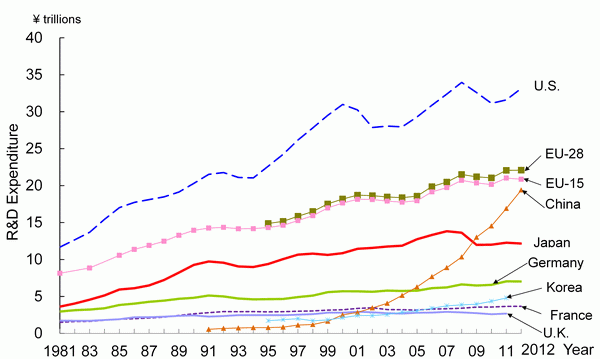
Looking at Chart 1-3-3 (A), Japan's R&D expenditure in the public organization sector in FY 2012(6) was 12.2 trillion yen. The expenditure level has been trending flat since seeing a significant decrease in 2009.
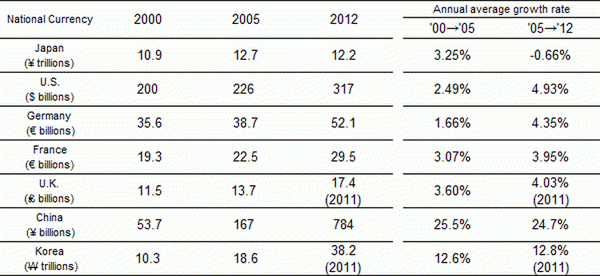
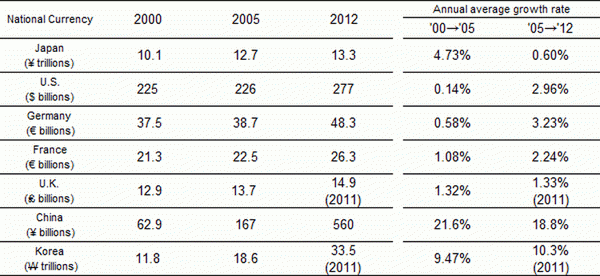
The U.S.'s expenditures had been decreasing since peaking in 2008 but have been showing an upward trend in recent years. As for other countries, Germany has been showing a slight increase, while France and the U.K. have remained flat. China has grown rapidly since the beginning of the 2000s. It surpassed Japan in 2009. Korea is also continuing to see growth. Turning to annual average growth rates in each country's national currency (nominal values) (Chart 1-3-3 (B)), almost all countries had higher growth rates during the second half of the 2000s (2005 through the most recent available year) than during the first half (2000-2005). However, Japan and China had lower growth rates during the second half. Annual average growth rates for real values (2005 base, national currency) adjusted in light of commodity prices in each country (Chart 1-3-3 (C)) show that the U.S., Germany and France had higher rates during the second half of the 2000s than during the first half.
Japan's growth rate was 4.73 % in the first half of the 2000s but fell to 0.6 % in the second half of the 2000s; it has shown almost no growth since then.
It should be noted that both China and Korea have always had fairly high annual average growth rates compared to other the countries.
(A) Nominal values (OECD purchasing power parity equivalent)
Note:
1) Refer to Chart 1-1-4 (B) for the definition of the business enterprise sector in each country.
2) R&D expenditure includes the field of social sciences and humanities (for Korea, only natural sciences until 2006)
3) Purchasing power parity equivalent is the same as for Reference Statistics E.
4) Real values were calculated with a GDP deflator (using Reference Statistics D).
5) The 2012 value for the U.S. is preliminary; 2012 values for Germany and France are provisional.
6) For Germany, data until 1990 are for the former West Germany. After 1991, data are for the unified Germany.
Source:
<Japan> Ministry of Internal Affairs and Communications, “Report on the Survey of Research and Development” ; OECD, “Main Science and Technology Indicators 2013/2”
<U.S.> NSF, “National Patterns of R&D Resources: 2011-12 Data Update”
<Germany> Bundesministerium fur Bildung und Forschung,“Bundesbericht Forschung 2004, 2006,” “Bundesbericht Forschung und Innovation 2010, 2012” ; from 2010: OECD,“Main Science and Technology Indicators 2013/2”
<U.K.> National Statistics website: www.statistics.gov.uk
<France, China, Korea and EU> OECD, “Main Science and Technology Indicators 2013/2”
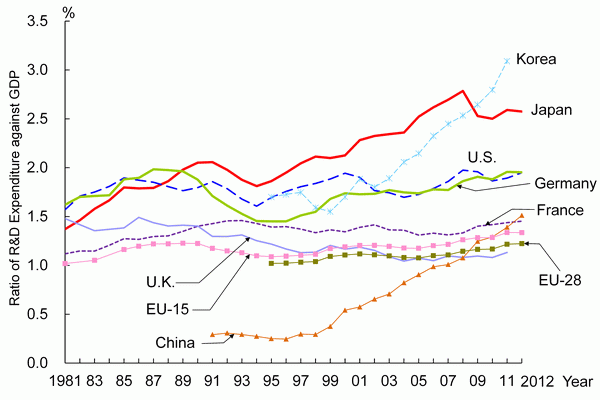
Chart 1-3-4 shows the “Ratio of R&D expenditure to GDP” for an international comparison considering the difference in the economy size of each country.
Looking at ratios of R&D expenditure to GDP in the business enterprises sector of the selected countries, Japan's ratio in 2012 was 2.58%. Although Japan had been ranked at the top here beginning in 1990, Korea has surpassed it since 2009. It should be noted that Korea's ratio in 2011 was fairly high at 3.09%.
The U.S.'s ratio has seen little change when viewed over the long term. The ratios of Germany, the U.K., and France have also shown long-term flat trends; however, Germany's ratio is showing a gradual increase. On the other hand, China's ratio has continued to catch up to those of the other countries in recent years. It surpassed the ratios of the U.K., EU and France in the latest available year.
Note:
1) GDP is the same as Reference Statistics C.
2) Same as in Chart 1-3-3.
Source:
Same as in Chart 1-3-3.
(2) By-industry R&D expenditures in selected countries
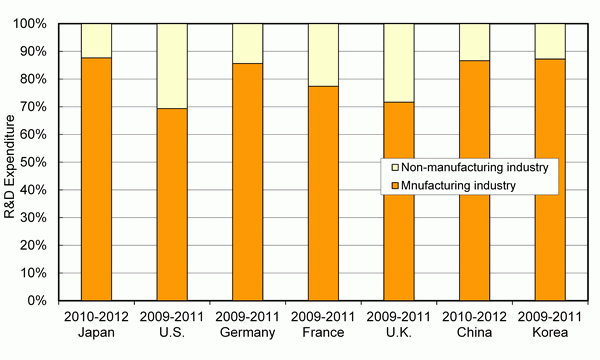
A look at three-year averages for manufacturing and non-manufacturing R&D expenditure in the business enterprises sector of the selected countries from the most recent available year for each country shows that the manufacturing shares of Japan, Germany, China and Korea approach 90%. In France, the share approaches 80%. On the other hand, the manufacturing shares for the U.S. and U.K. are roughly 70%, which means their non-manufacturing shares are large compared to the other countries. (Chart 1-3-5).

Note:
1) Since each country uses its own industrial classifications, care must be taken when making international comparisons.
2) See Chart 1-1-4 for definitions of the business enterprise sector in each country.
<Japan> 1) The industrial classification was made in accordance with the classification in the survey of research and development based on the Japan standard industry classification.
<U.S.> Industrial classifications use NAICS.
<Germany> German industrial classification, 2008 edition, was used.
<France> France activity classification table, "Nomenclature d'activites francaise (NAF) revised in 2003 was used.
Source:
<Japan> Ministry of Internal Affairs and Communications, “Report on the Survey of Research and Development”
<U.S.> NSF, "Science and Engineering Indicators 2014"
<Germany, France and Korea> OECD, "Structural Analysis (STAN) Databases"
<U.K.> OST, "SET statistics"
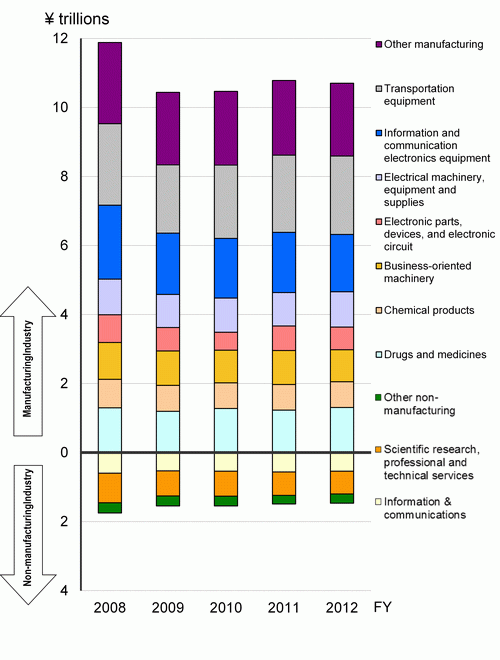
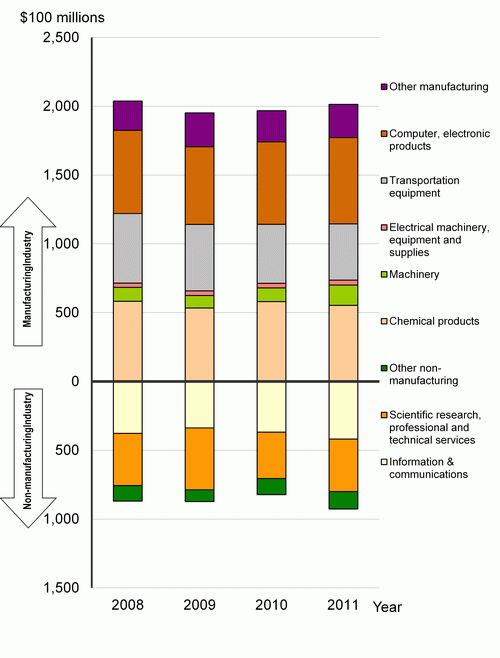
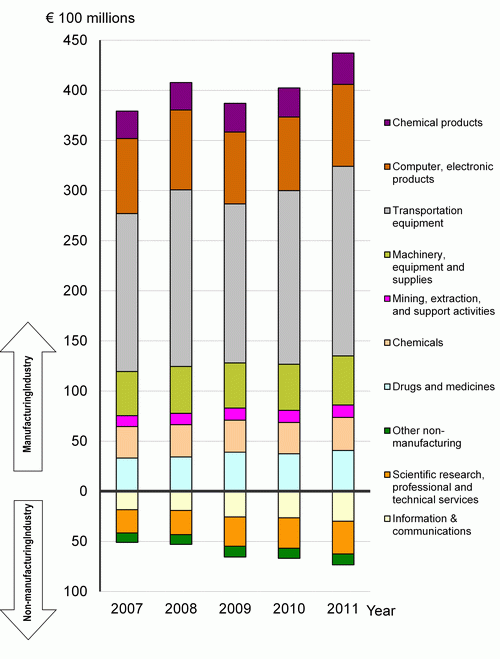
Chart 1-3-6 shows by-industry R&D expenditures for Japan, the U.S. and Germany. The business types used here were set for surveys of R&D statistics in the business enterprise sector, with reference to the standard industrial classifications used in each country. The standard industry types in each country generally follow the ISIC (International Standard Industrial Classification), but there is some variation by country. Rather than attempting to compare individual industries, this report instead looks at R&D expenditures according to the industrial structures of the countries.
Given the above, a look at Japan's R&D expenditure in terms of industrial classifications shows that the classifications with the largest shares among the manufacturing industries are “transport equipment” and “information and communication electronics equipment” followed by “drugs and medicines.” Among non-manufacturing industries, “scientific research, professional and technical services” has a large share.
Looking at industrial classifications for the U.S., among manufacturing industries, “computers, electronic products,” “chemical products,” and “transportation equipment” have large values. Among non-manufacturing industries, “information and communication electronics equipment" and “scientific research, professional and technical services” have large and growing shares.
In Germany's case, it is apparent that the shares of both manufacturing industries and non-manufacturing industries are growing. In terms of industrial classifications, “transport equipment” has a particularly large value, followed by “office equipment, computer, precision, electronic machinery." Among non-manufacturing industries, “scientific research, professional and technical services” has a large and increasing share.
Note:
Same as for Chart 1-3-5.
Source:
For Germany: Stifterverband Wissenschaftsstatistik, “FuE-Datenreport 2013” ; for other countries: same as for Chart 1-3-5.
(3) R&D expenditure per turnover amount in the business enterprise sector
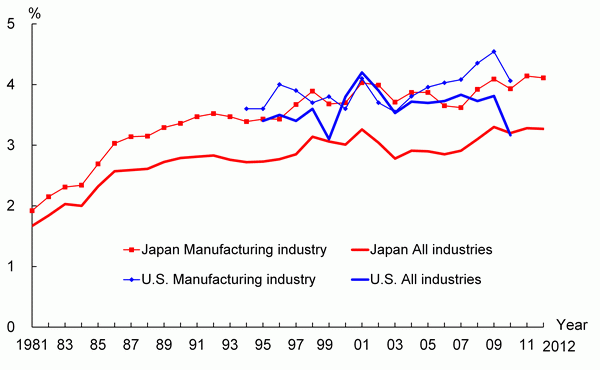
Chart 1-3-7 shows the trend of the ratio of the R&D expenditure against turnover in Japan and the U.S. The ratios are shown for both all industries together and for the manufacturing industry.
As far as Japan is concerned, the ratio in the manufacturing industry was higher than the ratio in all industries, showing Japan's stronger R&D intensity in the manufacturing industry compared to that in the non-manufacturing industry. On the other hand, in the case of the U.S., the ratios in the manufacturing industry and all industries were roughly the same around 2000; however, the ratio in the manufacturing industry subsequently rose above that in all industries.
Note:
<Japan>
1) Survey content and timing contained in the Ministry of Internal Affairs and Communications' “Report on the Survey of Research and Development” were changed beginning with the 2002 survey (applicable to FY 2001).
2) R&D expenditure per turnover in all industries is the figure from FY 2001 (all industries excluding finance and insurance industries).
3) The industrial classification adopted in the Survey of Research and Development was used based on Japan standard industry classification.
4) The classification adopted in the Survey of Research and Development was changed in its 1996, 2002 and 2008 versions to reflect revisions to the industrial classification.
<U.S.>
1) SIC were used until 1998 and NAICS has been used since 1999 as the industrial classification.
2) FFRDCs have been excluded since 2001.
Sources:
<Japan> Ministry of Internal Affairs and Communications, “Report on the Survey of Research and Development”
<U.S.> NSF, “R&D Industry” ; various years, "Business Research and Development and Innovation: 2008-10"
(4) Direct and indirect government support for business enterprises
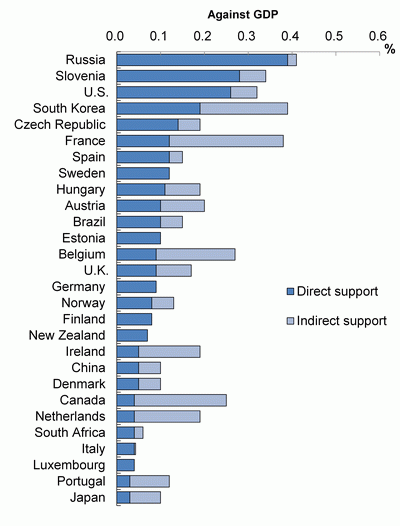
A look at "direct support (amount of business enterprises' R&D expenditures borne by the government)" and "indirect support (amount of business enterprises' corporate taxes to be paid to the government that is exempted through R&D tax incentives)" on a ratio to GDP basis in order to view government support for business enterprises' R&D shows that the share of indirect support is larger in Japan.
Looking at other countries, those in which direct government support to business enterprises is large include Russia, Slovenia and the U.S. Countries in which indirect support is large include France, Canada, and Belgium.
Both direct support and indirect support are large in Korea and France (Chart 1-3-8(A)).
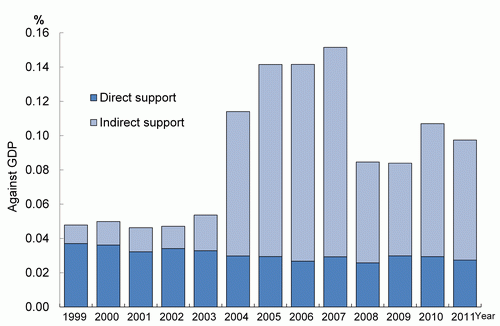
Turning to Japan, Chart 1-3-8(B) shows changes in government direct and indirect support. As seen in the chart, direct support from the government for business enterprises has declined year by year. Indirect support increased sharply in 2004, and decreased in 2008.
The sharp increase in indirect support in 2004 likely stems mainly from a tax credit for total experimental and research expenses that was adopted in 2003. The number of business enterprises utilizing them is thought to have increased in 2004. The decrease in 2008 is probably because of a decrease in total corporate taxes, which caused a decrease in deductions.
(A) Comparison of major countries (2011)
Note:
1) Values estimated by each country (in accordance with the survey for R&D tax incentives by NESTI). Preliminary budget values are also included.
2) Values for China, South Africa, and Luxembourg are for 2009; values for Spain, Brazil, Belgium, and Ireland are for 2010.
3) Data on indirect support was not provided for Estonia, Finland, Germany, Luxembourg, Mexico, New Zealand, Sweden, and Switzerland.
Source:
OECD, “STI Scoreboard 2013"
Sources:
Ministry of Internal Affairs and Communications, "Report on the Survey of Research and Development," National Tax Agency, "Corporation Sample Survey"; data for 2011 are from OECD, "STI Scoreboard 2013"
Column: R&D expenditure by business enterprises--recovery from the global economic crisis
The business enterprises sectors of Japan, several major countries of Europe, and the U.S. reported lower R&D expenditures in 2009(7) (see Chart 1-3-3). Such a simultaneous decline in multiple countries is unusual, and is believed to have been caused by the effects of the international economic crisis (called the “Lehman Shock” in Japan) that occurred in the previous year. While the circumstances of this development were discussed in columns in the 2012 and 2013 editions of the Japanese Science and Technology Indicators, this column will focus on recovery from such an economic crisis.
(1) Changes in R&D expenditure in the business enterprise sectors of selected countries before and after 2009
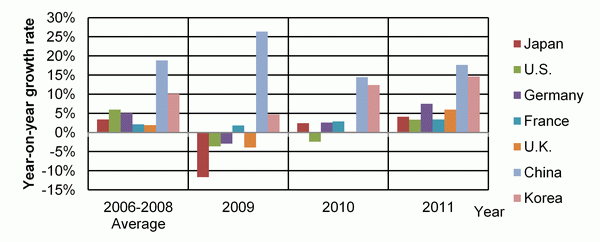
Year-on-year R&D expenditures (real value) in the business enterprise sectors of selected countries are shown in Chart 1-3-9. In all cases, the R&D expenditures of those countries grew between 2006 and 2008. However, in 2009, which was the year following the bankruptcy of the U.S. investment bank Lehman Brothers (September 2008), the expenditures of Japan, the U.S., Germany, and the U.K. fell off. Of these, the decline in Japan was particularly striking, demonstrating the large degree to which the global economic crisis affected R&D by Japan's business enterprises.
The following year, 2010, all of the countries with the exception of the U.S. saw a return to growth in their R&D expenditures. And in 2011, all of the countries posted positive year-on-year growth rates. Japan's year-on-year growth rate was 2.4% in 2010 and 4.1% in 2011.
in the business enterprise sectors of selected countries
Note:
R&D expenditures are 2005-based real values that were calculated with a GDP deflator.
Source:
Same as for Chart 1-3-3. The GDP deflator is the same as for Reference Material D.
(2) Changes in Japan's R&D expenditure
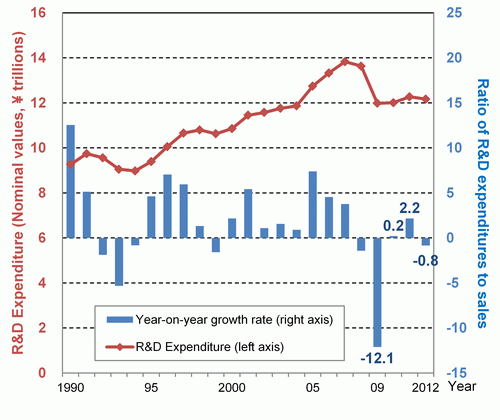
Next is a discussion of Japan from a long-term perspective. From 1995, R&D expenditure in Japan's business enterprises sector showed a long-term upward trend, with particularly high levels achieved during the period between 2005 and 2007. Then, in 2009, the year-on-year growth rate plunged to -12.1%. This was the largest rate of decrease since 1953, when recording of R&D statistics in Japan began.
In the following year, 2010, R&D expenditure began to increase again, and in 2011, the rate grew by 2.2% compared to the previous year?this despite the Great East Japan Earthquake that occurred in March. This year, 2011, is thought to have been a time of recovery in expenditure following the depressed conditions of 2009. A contributing factor here is believed to be that the effects of the Great East Japan Earthquake were not so strong as to directly push down overall R&D expenditure in the business enterprises sector. However, in the following year, 2012, the year-on-year R&D expenditure growth rate fell to -0.8%. In any event, R&D expenditures for 2009 and subsequent years have been at around the 12-trillion-yen level, which is substantially lower than the 2005 to 2007 level.
Note:
R&D expenditures are nominal values.
Source:
Ministry of Internal Affairs and Communications, “Report on the Survey of Research and Development”
(3) The relationship between sales and R&D expenditures
This section looks at sales as a determining factor in enterprises' R&D expenditure. Many Japanese enterprises set a general amount for R&D expenditure at the beginning of each fiscal year. In such cases, they base their decisions on sales estimates and sales figures from the previous fiscal year. Thus, expenditure often either moves immediately with sales or reflect changes in sales a year earlier.
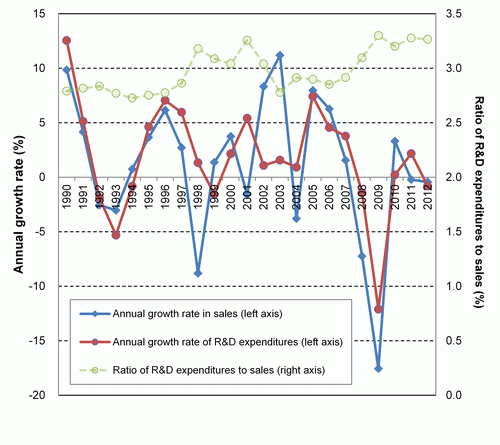
In actuality, a look at year-on-year growth rates for R&D expenditure and sales of Japanese business enterprises (Chart 1-3-11) shows an overall linked trend. In the case of 2009, in particular, it is clear that the decline in R&D expenditure was linked to a considerable fall in sales.
Subsequently, both sales and R&D expenditure returned to growth in 2010; however, sales once again fell in 2011, as did R&D expenditure in 2012. As was mentioned above, the R&D expenditure growth rate showed a substantial increase at 2.2% in 2011; however, given sales in that year and the following year, it is thought that such growth was unsustainable.
However, the ratio of R&D expenditure to sales (Chart 1-3-11) reached its highest level ever in 2009 and maintained high levels through 2010 to 2012. The ratio of R&D expenditure to sales, which is an indicator showing the degree of focus that business enterprises place on R&D, has remained at a high level since 2009. It is therefore thought that business enterprises are continuing to emphasize R&D.
Note:
R&D expenditures and sales are both nominal values and based on figures of businesses engaged in R&D (excluding finance and insurance industries),
Sources:
Ministry of Internal Affairs and Communications, “Report on the Survey of Research and Development"
(4) Breakdown of items showing changes in R&D expenditure
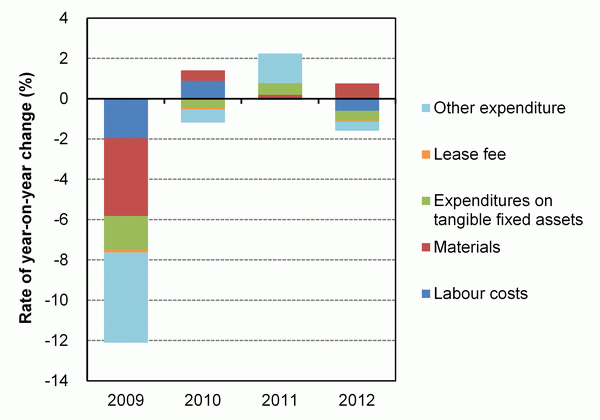
Looking at a breakdown by category of the cuts to R&D expenditures by Japanese corporations in 2009, cuts to "materials" and "other expenditure" were large, while those to "labor costs," which accounts for a large percentage of total R&D expenditures, were relatively small (Chart 1-3-12). Subsequently, "labor costs" and "materials" grew in 2010, while "other expenditure" and "expenditures on tangible fixed assets" grew in 2011. Thus, the circumstances surrounding increases for individual items vary from year to year. The year 2012 is characterized by a decrease in "labor costs" amid an overall decrease since 2009.
Source:
Ministry of Internal Affairs and Communications,” Report on the Survey of Research and Development”
(5) Summary
During the worsening economic climate of 2009, Japanese enterprises carried out unprecedented cuts to R&D expenditures. However, in that year and since then, the ratio of R&D expenditures to sales has remained at a high level, and thus it is thought that, in general, corporations appear to have maintained their stance of emphasizing R&D.
The Great East Japan Earthquake of March 2011 did not have any direct effects in terms of dragging down overall R&D expenditure by Japanese corporations. However, amid an environment of sluggish sales, recent R&D expenditure by enterprises has remained at about the level that prevailed in the early 2000s.
(Hiroyuki Tomizawa)
(6) This section uses "years" for international comparison, although in the case of Japan, it is originally "fiscal years."
(7) According to FY 2009 amounts. In this column, Japanese monetary amounts will be based on fiscal year data, but will be referred to as "years" for comparison with personnel data and foreign countries data.

