1.3 R&D expenditure by sector
1.3.1 R&D expenditure in the public organization sector
Key points
- Japan's R&D expenditure in the public organization sector in FY 2012 was 1.37 trillion yen. The expenditure level has been trending flat from the early 2000s.
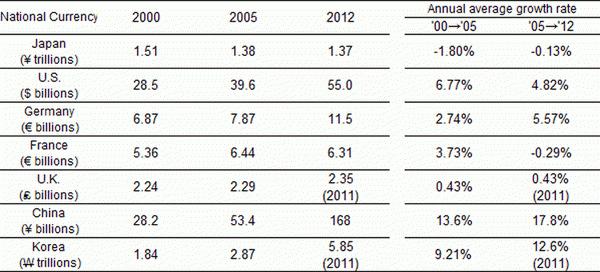
- Looking at average annual growth rate in R&D expenditure (nominal values) on a national currency basis, only Japan had a negative growth rate during the latter half of the 2000s (2005 through the most recent available year). In contrast, the other countries showed growth, with China posting a particularly high rate of 17.8%.
(1) R&D expenditure in the public organization sector for each country
In this section, the public organization sector as a performing sector of R&D expenditure is explained.
The public organizations of each country analyzed here include the following research institutes (reference: Chart 1-1-4 (B)). In Japan, “National” research institutes (national experimental and research institutes, etc.), “Public” research institutes (public experimental and researching institutes, etc.), and research institutes run by “Special and independent administrative corporations” are included.
In the U.S., research institutes (NIH etc.) run by the federal government, and those which belong to FFRDCs (government-funded, with R&D carried out by the industrial, university and non-profit institution sectors) are included.
In Germany, research institutes run by the federal government and local governments and other public research institutes, non-profit institutions (receiving 160,000 Euros or more as public funds) and the research institutes except for higher education institutions are included. It must be noted that in Germany, “the public institution sector” and “the non-profit institution sector” are not separated.
In France, research institutes run by certain types of foundation such as scientific and technical research public establishment (“Etablissement Public a Caractere Scientifique et Technologique” (EPST)) (other than CNRS) and commercial and industrial research public establishment (“Etablissement Public a Caractere Industriel et Commerce” ) (EPIC), etc. are included.
In the U.K., research institutes run by the central government, decentralized governments and research councils are included.
In China, research institutes run by the central government are included. And in Korea, national and public research institutes, government supported research institutes and national and public hospitals are included.
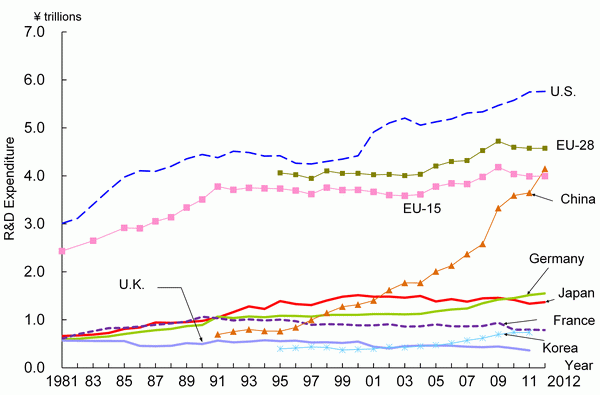
Chart 1-3-1(A) shows the trend of R&D expenditure (by OECD purchasing power parity equivalent) in the public organization sector for selected countries. Japan's R&D expenditure in the public organization sector in FY 2012 was 1.37 trillion yen. The expenditure level has been trending flat from the early 2000s. Although R&D expenditure was flat in each country at the beginning of the 1990s, China started rapidly increasing its R&D expenditure during the middle of that decade, and its expenditure passed Japan's in 2002. As of the latest available year, China's expenditure is roughly the same as EU-15. In addition, the U.S. has been showing an increasing trend since entering the 2000s, with German and Korea following suit from the mid-2000s.
Chart 1-3-1(B) shows the annual average growth rate of R&D expenditure (nominal values) in each country on a national currency basis. During the first half of the 2000s (2000-2005), only Japan posted negative growth while all the other countries showed positive growth. The growth rate in the U.K., however, was less than 1%. Japan and France had negative growth rates during the latter half of the 2000s (2005 through the most recent available year). In contrast, the other countries showed growth, with China posting a particularly high rate of 17.8%.
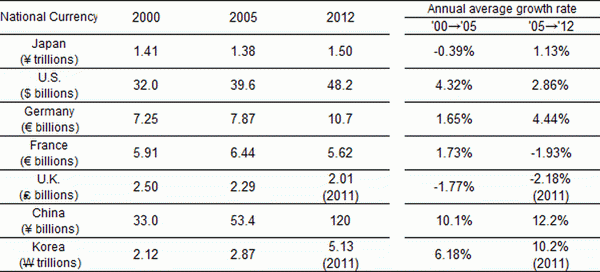
Looking at a comparison of real values adjusted to remove the influence of price fluctuations on a national currency basis (Chart 1-3-1(C)), Japan and the U.K. showed negative growth in the first half of the 2000s, while all the other countries increased. The countries with high increases in growth rates from the first half to the second half of the 2000s were Japan, Germany, China and Korea. On the other hand, the countries with small growth rates in the second half of the 2000s were the U.S. and France, and the U.K; the U.K. had particularly large negative growth.


Note:
1) The definition of the public organization sector differs depending on the country. Therefore it is necessary to be careful when making international comparisons. Refer to Chart 1-1-4 for the definition of sectors in each selected country.
2) R&D expenditure includes the field of social sciences and humanities (for Korea, only natural sciences until 2006)
3) Purchasing power parity equivalent is the same as for Reference Statistics E.
4) Real values were calculated with a GDP deflator (using Reference Statistics D).
<Japan> Values include profit-making special corporations and independent administrative corporations from FY 2011.
<Germany> Until 1990, data is for the former West Germany. After 1991, data is for the unified Germany.
Source:
<Japan> Ministry of Internal Affairs and Communications, “Report on the Survey of Research and Development”
<U.S.> NSF, “National Patterns of R&D Resources: 2011-12 Data Update”
<Germany> Bundesministerium fur Bildung und Forschung,“Bundesbericht Forschung 2004, 2006,” “Bundesbericht Forschung und Innovation 2010, 2012” ; from 2010: OECD,“Main Science and Technology Indicators 2013/2”
<U.K.> National Statistics website: www.statistics.gov.uk
<France, Korea and EU> OECD, “Main Science and Technology Indicators 2013/2”
(2) R&D expenditure in Japan's public organization sector
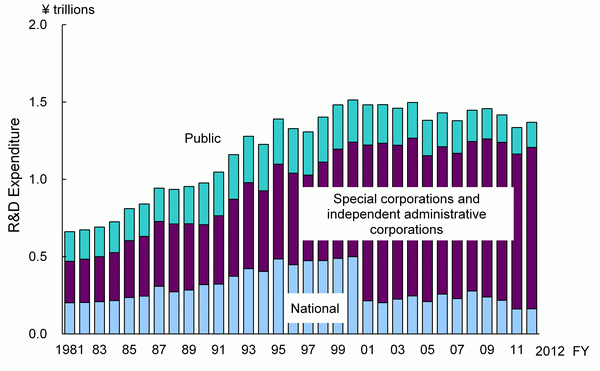
Chart 1-3-2 shows the trend of R&D expenditure in Japan's public organization sector by type of organization. R&D expenditure in all the research institutes had been increasing until FY 2000 in spite of some slight fluctuations; however, after entering the 2000s the expenditure level trended flat before entering a declining trend in recent years.
Out of all sectors, the amount in that of “special corporations and independent administrative corporations” is the highest. Another matter which should be mentioned is the discontinuity between the data for “national” research institutes and that for “special corporations and independent administrative corporations” due to the fact that former national research institutes and special corporations turned into independent administrative corporations in FY 2001. It should also be added that profit-making organizations have also been included among “special corporations and independent administrative corporations” since FY 2011.


