1.2 Government budgets
ポイント
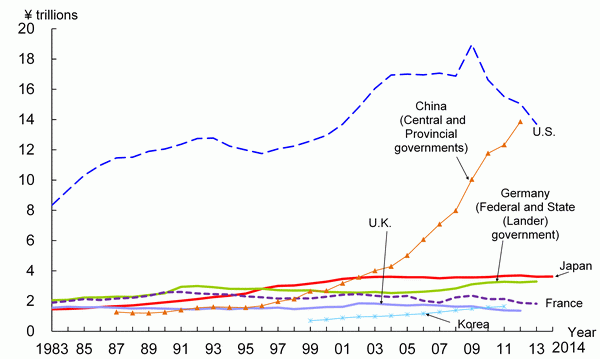
- Japan's total GBAORD amounts to 3.6 trillion in 2014. Growth in Japan's total GBAORD has stagnated since entering the 2000s.
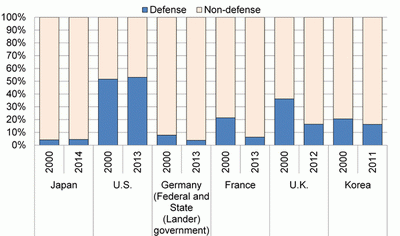
- Japan's total GBAORD is comprised almost entirely of non-defense expenditure, as national defense accounted for less than 5%. On the other hand, in the U.S., the share of GBAORD for national defense exceeds 50%, which makes it larger than the share for the civilian sector.
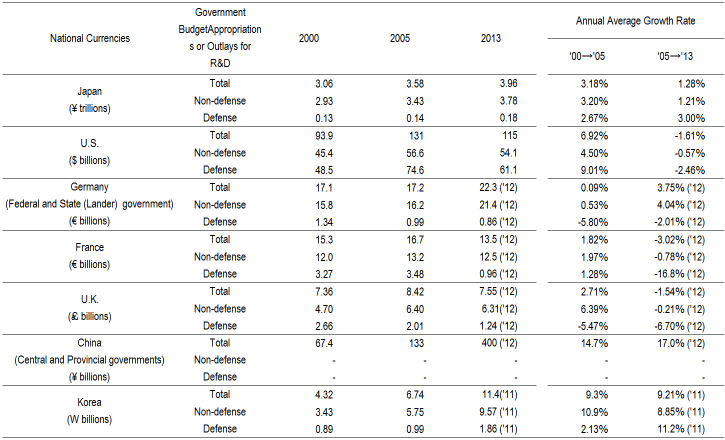
- A look at the GBAORD of the selected countries (real values, national currencies based on 2005 rates) shows that the countries with higher annual average growth rates in the second half of the 2000s than the first half are Germany and China.
- The country with the largest ratio of R&D expenditure funded by the government among the selected countries is France, whose ratio was 35.4% in 2011. Japan has the lowest ratio among the seven countries, with a government-funded ratio of 19.1% in 2012 (16.4% in 2011 in the case of Japan (estimated by the OECD)). The ratios of almost all of the countries were in a decreasing trend until around 2000 and have leveled out since then; however, China's ratio has continued to decrease.
- Since entering the 2000s, Japan's initial budget for S&T has been mostly unchanged. Supplemental budgets have been added each year, with particularly large budgets prepared in FY 2009, 2011, and 2012. Moreover, the ratio of competitive funding in the initial budget is 11.0%, which represents a decrease from the 2009 peak.
In this chapter, GBAORD included in each country's government budget is examined.
In this report, Japan's “government budget appropriations for Science & Technology (S&T)” are treated as the GBAORD. The government appropriations for S&T are composed of (1) funds for promoting science and technology (a part of the general account, with the main purpose of appropriation in the promotion of science and technology) (2) other research expenditure included in the general account, and (3) the government budget appropriation for S&T included in the special account.
1.2.1 GBAORD in each country
An examination of total GBAORD (by OECD purchasing power parity equivalent) of the selected countries’ governments (Chart 1-2-1 (A)) shows that Japan has a total of 3.6 trillion yen in 2014(4). When viewed over the long term, Japan's GBAORD is growing; however, the rate of this growth has been slowing since the early 2000s.
In the case of the U.S., there has been a continuing declining trend since special funds were allocated in 2009 under the American Recovery and Reinvestment Act of 2009 (ARRA).
Germany and Korea had been seeing a gradual and consistent increase, although growth has been accelerating since the mid-2000s. France had been unchanged during the 2000s. A declining trend has become evident in recent years. China has shown remarkable increases since entering the 2000s.
An examination of GBAORD that classifies defense-related expenditure (defense; in Japan's case, GBAORD of the Ministry of Defense) from other expenditure (non-defense) (Chart 1-2-1 (B)) reveals that nearly the entirety of Japan's GBAORD goes to the non-defense sector. In FY 2014, 5% or less goes to the defense sector. There has been little change in this trend. On the other hand, in the U.S., the share of GBAORD for national defense exceeds 50%, which makes it larger than the share for the non-defense sector. This share is increasing slightly. In the other countries, the shares of GBAORD for defense are comparably smaller than that for non-defense, but still large when compared to Japan and Germany.
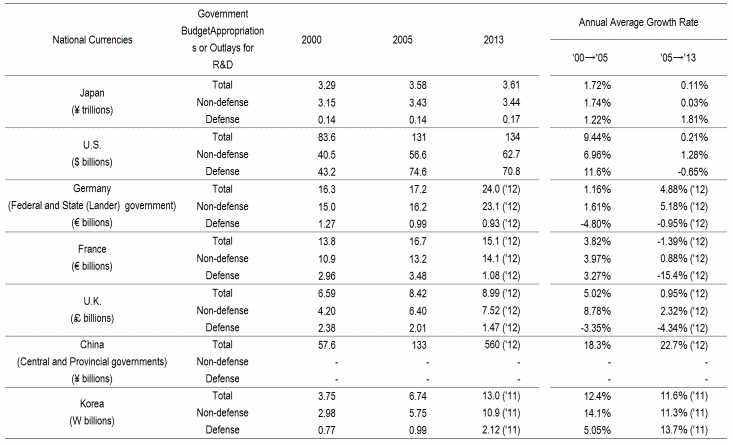
A comparison of the annual average growth rates of total GBAORD for the first half of the 2000s (2000 to 2005) and the second half of the 2000s (2005 to 2013) (Chart 1-2-1 (C)) shows that the countries with higher rates in the second half than the first half are Germany and China. All of the other countries have lower rates in the second half; however, while Korea is lower, it has had a larger increase compared to the other countries in the second half.
Moreover, an examination of changes in real values, excluding the effects of price fluctuations (Chart 1-2-1 (D), shows that the countries with higher annual average growth rates in the second half of the 2000s than the first half are Germany and China. The other countries have declining rates, with France showing negative growth.
A look at annual average growth rates for defense-related budgets in terms of nominal value shows that the countries showing positive growth are Japan and Korea. The same applies when budgets are viewed in terms of real value.
Notes:
1) Reference statistics E was used for the conversion to obtain purchasing power parity equivalent.
2) Real values were calculated with a GDP deflator (using Reference Statistics D).
<Japan> Data for all the fiscal years are of initial budget amounts.
<U.S.> Data are for the federal government or central government only. Of the general payments to the higher education sector, those for which no separation can be drawn between education and research are excluded. Capital expenditure was largely or entirely excluded. Data continuity with the previous year is impaired for 2000 and 2009. The FY 2009 figure includes special funding allocated under the ARRA (American Recovery and Reinvestment Act of 2009). The FY 2013 values are OECD Secretariat estimates/projections based on country materials.
<Germany> Data continuity with the previous year is impaired for 1984, 1985, 1987, 1991, and 1997. Data for 1992 are national projections or estimated values; data for 2013 are provisional values.
<France> Data continuity with the previous year is impaired for 1984, 1986, 1992, 1997, and 2006. For 2006 and 2007, figures were underestimated or based on underestimated data.
<U.K.> Data continuity with the previous year is impaired for 1985 and 2001. Data for 2012 are national projections or estimated/provisional values.
Source:
<Japan> Ministry of Education, Culture, Sports, Science and Technology data
<U.S., Germany, France, U.K., and Korea> OECD, “Main Science and Technology Indicators 2013/2”
<China> China Science and Technology Statistics; "S&T Statistics Data Book" (website)
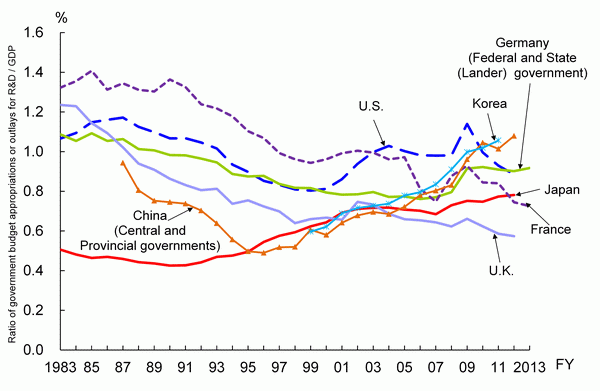
Next, each country's ratio of GBAORD against GDP is shown for comparison to reduce the effect of the scale of the country's economy (Chart 1-2-2). The value for Japan increased during the 1990s and was flat during the 2000s but has been increasing slightly from the mid-2000s. Looking at the other countries, the values for the U.S. and France have been decreasing continuously since 2009, while that for Germany has been unchanged in recent years. The values for both China and Korea have been showing remarkable growth since the early 2000s.
The ratios for the latest available year were 0.78% in Japan, 0.88% in the U.S., 0.92% in Germany, 0.73% in France and 0.57% in the U.K. The highest ratio was in China with 1.08%, followed by Korea with 1.06%.
Note:
<GBAORD> Same as Chart 1-2-1
<GDP> Same as Reference statistics C
Source:
<GBAORD> Same as Chart 1-2-1
<GDP> Same as the reference statistics C
1.2.2 Ratio of R&D expenditure funded by the government in each country
The following are two methods for surveying government-funded R&D expenditure:
(1) Sum up the results of the survey conducted by each performing sector to obtain its government-funded R&D expenditure
(2) Obtain R&D related expenditure (the GBAORD(5)) out of the government expenditure. (See Section 1.2.1.)
Of the above mentioned two, method (1) which is conducted by the side of performing sectors can provide the total R&D expenditure, even if the flow of the expenditure is complicated, under the condition that the targets of the survey cover the entire country. However, the sources of the R&D expenditure are not always precisely identifiable. On the other hand, it is difficult for method (2) which is conducted from the side of expenditure source (the GBAORD) to obtain accurate R&D expenditure because it is unknown whether or not the entire amount was used for the purpose of R&D in actuality.
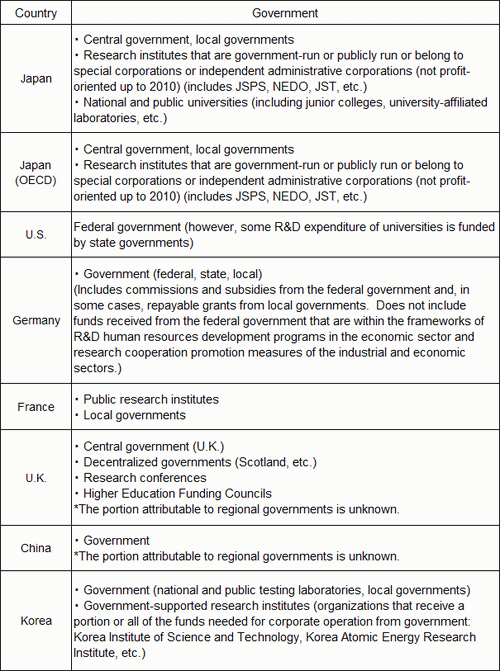
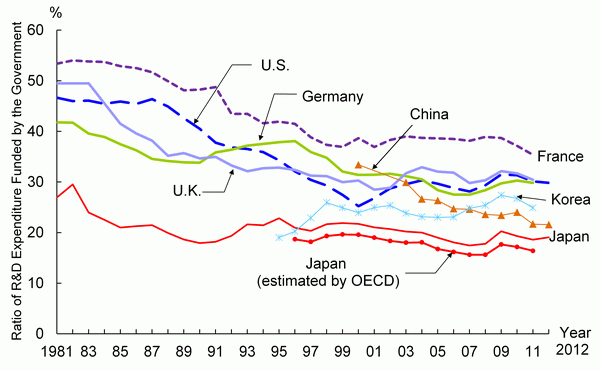
In this section, method (1) by the side of performing sectors is used to show the status of each government's R&D expenditure. With this method, the ratio of the R&D expenditure which was funded by the government for each sector against the total R&D expenditure in each country is examined. The expression “the government” here mainly represents the central government, but what is represented depends on the country. Chart 1-2-3 shows a simple definition of “the government” for each country.
A look at the ratio of R&D expenditure funded by the governments of the selected countries (Chart 1-2-4) shows that the country with the largest ratio is France, whose ratio was 35.4% in 2011. Japan has the lowest ratio among the seven countries, with a government-funded ratio of 19.1% in 2012 (16.4% in 2011 in the case of Japan (estimated by the OECD)).
It deserves mentioning that the ratios of almost all of the countries were in a decreasing trend until around 2000 and have leveled out since then; however, China's ratio has continued to decrease.
Note:
Same as Chart 1-1-4(B).
Sources:
Same as Chart 1-1-4(B).

Note:
1) When an international comparison is conducted, it should be noted that the R&D expenditure which is investigated by the side of performing sectors may be funded exclusively by the central government, or by both central and local governments, depending on the country. The definition of each country's "government" is referred to in Chart 1-2-3.
2) R&D expenditures include humanities and social sciences (for Korea, only natural sciences until 2006).
Source:
<Japan> Ministry of Internal Affairs and Communications, “Report on the Survey of Research and Development”
<U.S.> NSF, “National Patterns of R&D Resources 2011-12 Data Update”
<Germany> Bundesministerium fur Bildung und Forschung,“Bundesbericht Forschung 2004, 2006,” “Bundesbericht Forschung und Innovation 2010, 2012” ; from 2010: OECD,“Research & Development Statistics 2013”
<Japan (OECD estimate), France and Korea> OECD, “Research & Development Statistics 2013”
<U.K> National Statistics website: www.statistics.gov.uk
<China> Ministry of Science and Technology of the People's Republic of China, "China Science and Technology Indicators"; S&T Statistics Data Book (website)
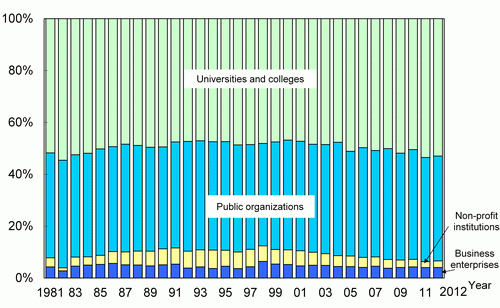
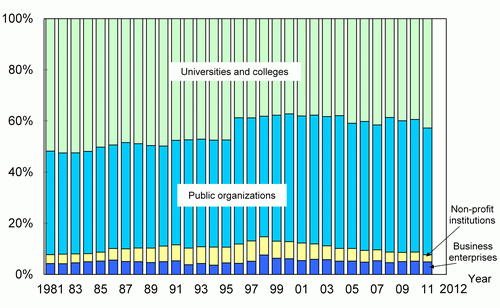
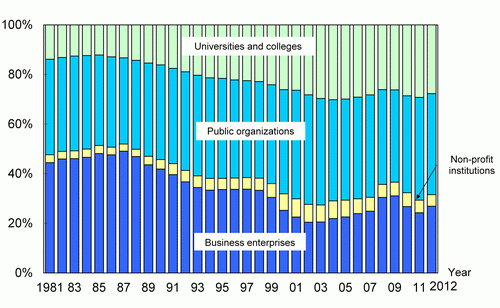
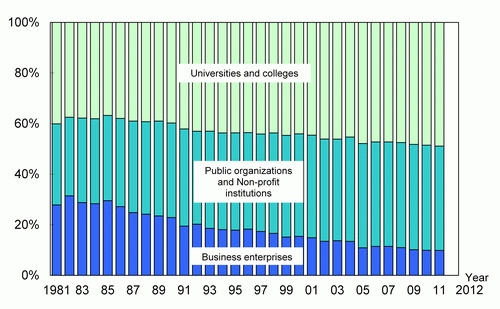
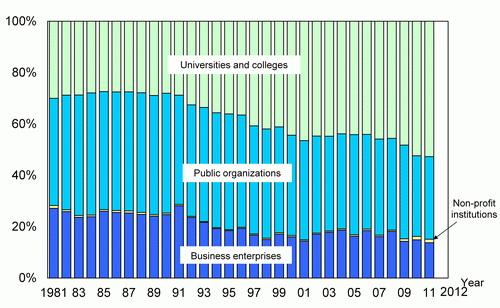
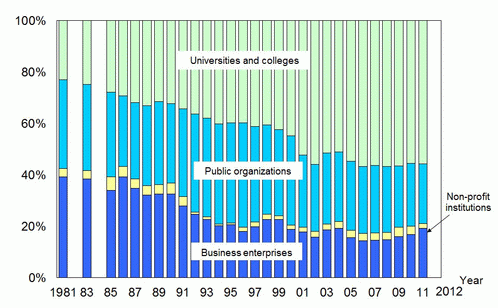
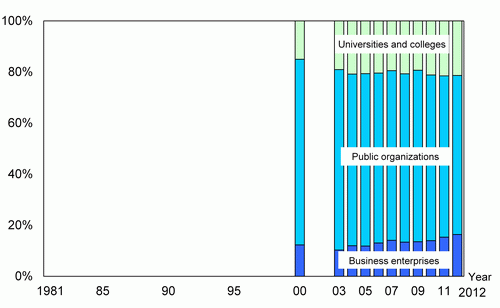
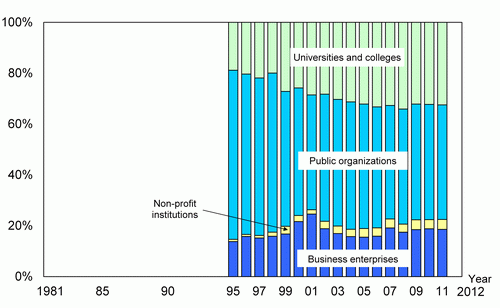
Next, differences in national policy on R&D expenditure for each country are examined by means of observing the breakdown of R&D expenditure (funded by the government) by performing sector. In other words, they are examined by understanding what proportion of government funds was used in each performing sector (Chart 1-2-5).
In the case of Japan, no significant change in each sector occurred. The university and college sector and the public organization sector accounted for the major portion of R&D expenditure through the period of the chart. Limited spending on the business enterprise sector as compared to other countries is characteristic of Japan.
In the U.S., previously a large share of R&D expenditure was allocated to the business enterprises sector. Beginning in the latter half of the1980s, this share decreased significantly while the share for the universities and colleges sector increased. However, although the share for the business enterprises sector had been increasing since 2002, it peaked in 2009 and is beginning to decrease.
In Germany, the share of expenditure for the business enterprises sector has been decreasing since the mid-1980s, while that for the universities and colleges sector and public organizations and non-profit institutions sector has been increasing.
In France, previously the proportion for the public organizations sector was large, and that for the universities and colleges sector was relatively small. Starting in the 1990s, however, the proportion for the universities and colleges sector increased while that for the public organizations sector and the business enterprises sector decreased. The proportion to the business enterprises sector has been stable since entering the 2000s.
In the U.K., spending for the universities and colleges sector tended to substantially increase from 1981 to 1996, while the proportion for the business enterprises sector declined. Shares for all sectors leveled out upon entering the 2000s, although an increase in spending for the business enterprises sector has become apparent in recent years. The proportion for the public organizations sector has gradually been declining since the latter half of the 1990s.
In China, R&D expenditure for the public organizations sector is large but in a downward trend. On the other hand, shares for the business enterprises and universities and colleges sectors are increasing.
In Korea, expenditure for the public organizations sector is similarly large but showing a downward trend, while that for the universities and colleges sector is increasing. Expenditure for the business enterprises sector has remained stable since the beginning of the 2000s.

 (A) Japan
 (B) Japan (estimated by OECD)
Note:
1) Attention is required for international comparison as in Chart 1-2-4
2) R&D expenditure includes the field of social sciences and humanities (for Korea, only natural sciences until 2006)
<Japan> The government refers to the national government, local public governments, national research institutes, public research institutes, research institutes run by special corporations and independent administrative corporations, national and public universities (including junior colleges etc.).
<Japan (estimated by OECD)>
1) Attention is required when observing time series changes, as values that have been adjusted and estimated by the OECD (by converting the labor costs of the universities and colleges sector in R&D expenditure with FTE ) have been used since 1996.
2) The government refers to national government, local public government, national research institutes, public research institutes and research institutes run by special corporations and independent administrative corporations.
<U.S.> The government refers to the federal government. Values for 2012 are preliminary.
<Germany> Until 1990, data is for the former West Germany. After 1991, data is for the unified Germany. The government refers to the federal government and local governments.
<France> The government refers to public research institutes.
<U.K.> The government refers to the central government (including decentralized governments), research councils and the Higher Education Funding Council.
<Korea> The government refers to government research institutes and government supported research institutes.
Source:
<Japan> Ministry of Internal Affairs and Communications, “Report on the Survey of Research and Development”
<U.S.> NSF, “National Patterns of R&D Resources 2011-12 Data Update”
<Germany> Bundesministerium fur Bildung und Forschung,“Bundesbericht Forschung 2004, 2006,” “Bundesbericht Forschung und Innovation 2010, 2012” ; from 2010: OECD,“Research & Development Statistics 2013”
<Japan (OECD estimate), China, France and Korea> OECD, “Research & Development Statistics 2013”
< U.K.> OECD, “Research & Development Statistics 2013” ; National Statistics website: www.statistics.gov.uk since 1992 www.statistics.gov.uk
1.2.3 GBAORD (the government budget appropriations for S&T) in Japan
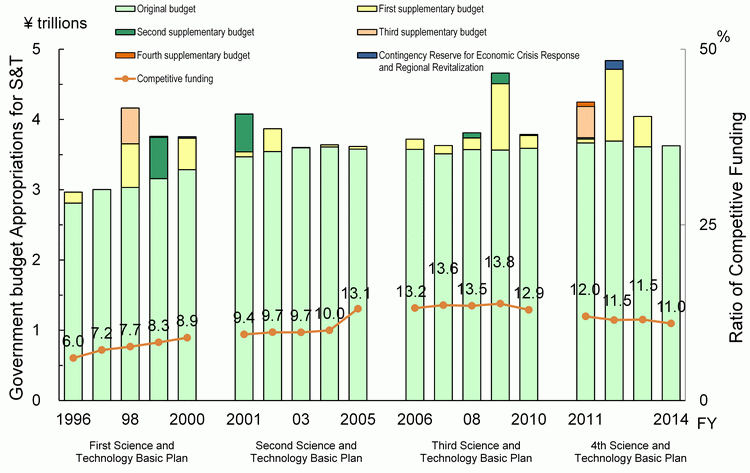
Science and Technology Basic Plans are based on the Science and Technology Basic Act proclaimed and implemented in November 1995. They are basic plans for the comprehensive and systematic advancement of policies designed to promote science and technology. With a view towards the coming 10 years or so, the government creates them to realize S&T policy over five years. This section will examine changes in GBAORD under each of the First to Fourth Science and Technology Basic Plans (hereafter “Basic Plan” ) (Chart 1-2-6).
The First Science and Technology Basic Plan covered FY 1996-2000. It indicated the necessity of total GBAORD of about 17 trillion yen. Actual GBAORD for the five years covered by the First Science and Technology Basic Plan totaled 17.6 trillion yen. Looking at the trend over the five years, initial budgets followed a rising trend. Substantial supplemental budgets were also added. The supplemental budget added during FY 1998 as economic stimulus made a major contribution to the total five-year budget.
The Second Science and Technology Basic Plan covered FY 2001-2005. It indicated that GBAORD needed to reach approximately 24 trillion yen. Actual (national) budgets during this period totaled approximately 18.8 trillion yen. Initial budgets increased slightly, with large supplemental budgets added in 2001 and 2002. With the 2.3 trillion yen from local government budgets added in, the total was 21.1 trillion yen.
In the Third Science and Technology Basic Plan, a total budget about 25 trillion yen for the five years from FY 2006 through FY 2010 was considered necessary. (This was predicated on a ratio of GBAORD to GDP during the period of 1%, with an average nominal GDP growth rate of 3.1%.) Initial budgets during the period totaled 19.6 trillion yen. The growth trend over the five years was flat for initial budgets, but FY 2009 added about 1 trillion through supplemental budgets. The five-year total was 19.6 trillion yen. With local government budgets added, the total was 21.7 trillion yen.
The Fourth Science and Technology Basic Plan covers the five years that began in 2011. It calls for total GBAORD of about 25 trillion yen during the five years. (This is predicated on a ratio of GBAORD to GDP during the period of 1%, with an average nominal GDP growth rate of 2.8%.)
Since entering the 2000s, Japan's initial budget for S&T has been mostly unchanged. Supplemental budgets have been added each year, with particularly large budgets prepared in FY 2009, 2011, and 2012. Moreover, the ratio of competitive funding in the initial budget is 11.0%, which represents a decrease from the 2009 peak.
Note:
1) The supplementary budgets were composed of only additional amounts.
2) In accordance with the formulation of the science and technology basic plans (from the first to the third) , the range of targeted costs were reviewed in FY 1996, 2001 and 2006.
Source:
Data from the Ministry of Education, Culture, Sports, Science and Technology.
Some basic indexes regarding GBAORD are shown below.
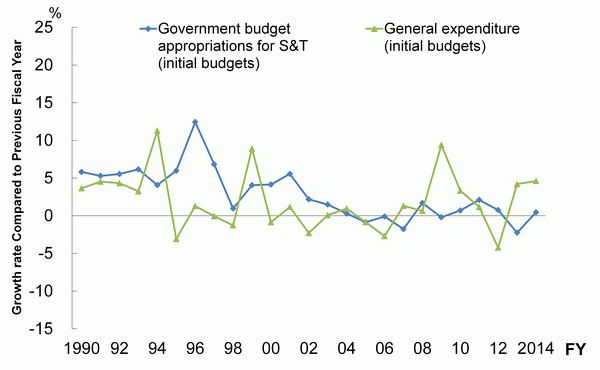
Chart 1-2-7 compares the growth rate compared to the previous fiscal year in GBAORD with the growth rate in general expenditures. General expenditures as used here is total general account expenditures minus debt servicing costs, local allocation tax and so on. Because their content and scale are decided at the government's discretion according to economic conditions, they can be considered government spending. By comparing their growth rate with that of GBAORD, the priority assigned to GBAORD in the budget can be discerned.
During the 1990s, the annual growth rate of GBAORD was high and it was usually higher than that of general expenditures. From about the middle of the 2000s, the GBAORD growth rate was about equal to that of general expenditures, but it has occasionally fallen below this level more recently.
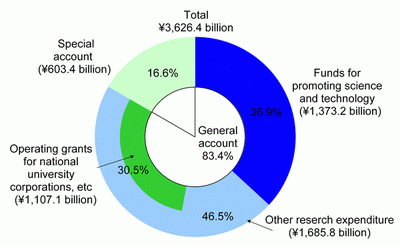
The ratio of the general account to special accounts in Japan's FY 2014 GBAORD is 83.4% to 16.6% (Chart 1-2-8). The general account comprises costs for national universities and public research institutes, "Funds for promoting science and technology" consisting of several grants and other research related costs, etc. Of the special accounts, those for supply and demand of energy (special accounts for the measures for structural improvement of petroleum and energy supply and demand) and for promotion of power development (special accounts for electric power development promotion measures) account for large shares.
Note:
1) These are initial budgets.
2) In accordance with the formulation of the science and technology basic plans (from the first to the third) , the range of targeted costs were reviewed in FY 1996, 2001 and 2006.
3) The FY 2011 budget compilation does not use "general expenditures." Instead, it uses "expenditures subject to the basic fiscal balance," which are general account expenditures minus debt servicing costs. The equivalent of general expenditures beginning with FY 2011 is therefore obtained by subtracting debt servicing costs and local allocation tax from general account expenditures.
Source:
Data from the Ministry of Education, Culture, Sports, Science and Technology; the Ministry of Finance; the Ministry of Finance: Fiscal Statistics (Budget and Balance Sheets) (from the official website)
Note:
Self income (by hospital income, tuition fees and commission projects, etc.) in the case of national university corporations. (This amount is the equivalent of the government budget appropriation for S&T in the national school special account system prior to the time when national universities, etc. were turned into corporations.)
Source:
Data from the Ministry of Education, Culture, Sports, Science and Technology (MEXT)
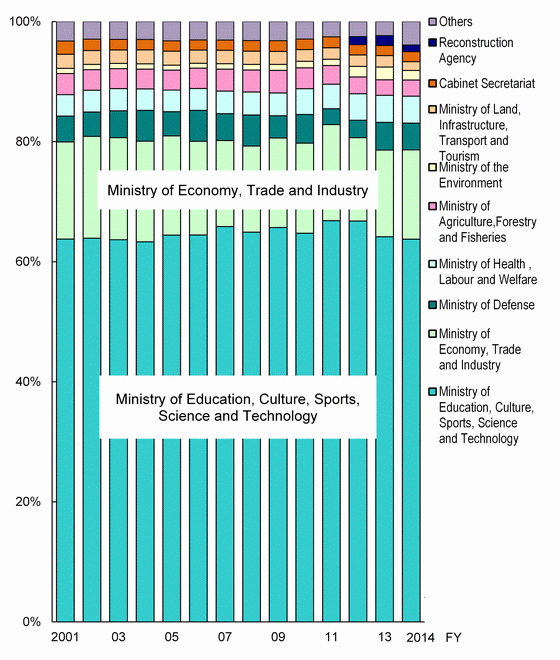
With regard to the breakdown of the government appropriations for S&T by ministry and agency, the Ministry of Education, Culture, Sports, Science and Technology consistently has the largest share, accounting for 63.8% in FY 2014. It is followed by the Ministry of Economy, Trade and Industry with 14.9% and other ministries and agencies with less 5% or less.
Accordingly, changes in other ministries and agencies are difficult to see; however, the shares for the Ministry of Health, Labour and Welfare and Ministry of the Environment have increased compared to FY 2001.
It should be noted that funding for the Reconstruction Agency was added in FY 2012. The agency's share in FY 2014 is 1.1%. (Chart 1-2-9).
Note:
1) Data for each fiscal year are for initial budgets.
2) Figures for government appropriations for S&T were compiled by the Ministry of Education, Culture, Sports, Science and Technology based on materials submitted by each ministry and agency.
3) The expenditure, etc. for each special corporation from the government budget appropriations for S&T which is included in the special account for Industrial investment under the jurisdiction of the Ministry of Finance is earmarked to the ministries etc. which have jurisdiction over the special corporations. But with regard to the National Agriculture and Bio-oriented Research Organization under the jurisdiction of the Ministry of Finance and the Ministry of Agriculture, Forestry and Fisheries, the expenditure is earmarked to only the latter.
Source:
MEXT, “Indicators of Science and Technology” ; Data from the Ministry of Education, Culture, Sports, Science and Technology
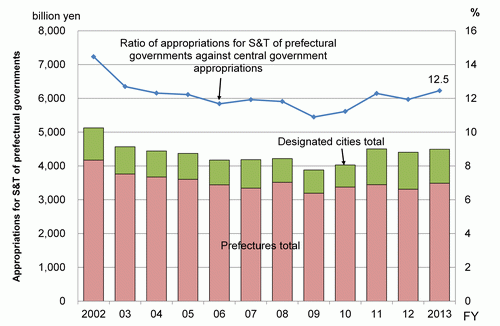
For an international comparison of national budget appropriations for S&T, it is necessary to include not only that of the central government, but also that of the local governments.
The original government budget appropriation for S&T allocated by 47 prefectures and 20 designated cities was approximately 449.6 billion yen in FY 2013. This amount was the equivalent of 12.5% out of the original government budget appropriation for S&T allocated by the national government (approximately 3.6 trillion yen) in the same fiscal year (Chart 1-2-10).
Note:
1) The amount is the initial budget.
2) The number of designated cities is as follows: FY 2002: 12; FY 2003 and FY 2004: 13; FY 2005: 14; FY 2006: 15; FY 2007 and FY 2008: 17; FY 2009: 18; FY 2010 and FY 2011: 19; FY 2012: 20
Source:
Data from the Ministry of Education, Culture, Sports, Science and Technology
(4)This section uses "years" for international comparison, although in the case of Japan, it is originally "fiscal years."
(5)Ordinarily, only the part of the S&T budget devoted to R&D (the R&D budget) should be studied, but there are no data on Japan's R&D budget. This report therefore uses S&T budget data. However, R&D accounts for most of Japan's S&T budget. R&D budget data are available for most countries other than Japan.

