In this chapter, the status of R&D expenditure in Japan and other selected countries, which is a basic index for R&D activities, is reviewed. R&D expenditure is the expenditure used for conducting R&D operations in an organization. It is widely used as quantitative measurement data regarding R&D inputs. This chapter also examines data on R&D expenditures from various angles, including each country's total R&D expenditures, their breakdown by sector and type, cost-sharing structures, and so on. The contents of this chapter also include mention of a part of the government budget appropriations or outlays for R&D (hereinafter referred to as GBAORD).
1.1 International comparison of R&D expenditure in each country
Key points
- Japan's total R&D expenditure (nominal value) was 17.3246 trillion yen (OECD estimate: 15.9 trillion yen) in FY 2012. (1) This figure has remained mostly unchanged since 2009.
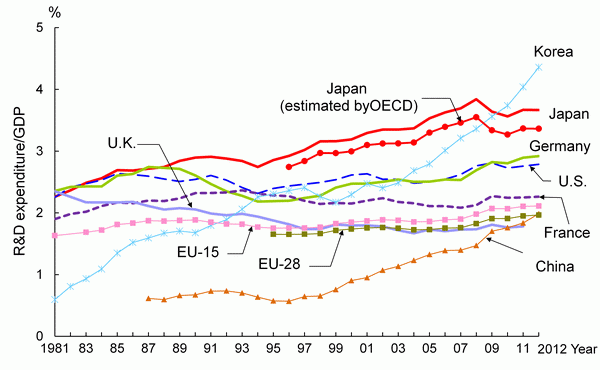
- Japan's total R&D expenditure against GDP peaked in 2008 and then entered a decline. However, in the most recent available year (2012), it was 3.67% and remained at the same level as the previous year. Looking at the R&D expenditure against GDP of other countries, Korea's expenditure has been growing rapidly since the 2000s and has recently reached levels that are far higher than those of other countries at 4.4% in 2012.
- In terms of proportion of total R&D expenditure by sector, “business enterprises” accounts for the largest proportion in all countries. The proportion is approximately 70% for Japan, the U.S., and Germany and approximately 60% for France and the U.K. In China, the share of “private enterprises” is growing and has accounted for approximately 70% in recent years. The proportion of “private enterprises” in Korea is approximately 80%.
- As for the proportion of R&D expenditure used in the "universities and colleges" sector, this proportion is 20% for Japan, Germany, and France, 10% for the U.S. and Korea, and 30% for the U.K. It should be noted that the only country seeing a long-term increase in this proportion is the U.K.
1.1.1 R&D expenditure trends in each country
First of all, the total R&D expenditure in selected countries is examined in order to provide an overview of their sizes and trends. A precise comparison of R&D expenditures among different countries is difficult because surveying methods for R&D expenditures differ by country; however, the comparison of the data in each country over time is considered to represent the trend of the country. For a comparison of R&D expenditures in each country, currency conversion is necessary. But, because of the conversion, the comparison inevitably falls under the influence of each country's economic conditions. Here, in principle, converted values are used for the international comparison of each country's R&D expenditure, and the value of each national currency is used for examining the change of R&D expenditure over time in the corresponding country.
Japan's R&D expenditures are shown with two types of values. One of such values was obtained from the Survey of Research and Development conducted and published by the Ministry of Internal Affairs and Communications. And the other values were obtained from materials published by the OECD(1). The values differ in how labor costs in the universities and colleges sector are handled. Strict separation of expenditures for research and for education in the universities and colleges sector is difficult. Thus, in the Survey of Research and Development, expenditures in the universities and colleges sector include faculty personnel expenses for non-research work (education, etc.). On the other hand, the OECD provides a total amount for R&D expenditure that is arrived at by converting personnel expenditure of Japan's universities and colleges to a full-time basis (for details, see R&D expenditure for the universities and colleges sector in Section 1.3.3).
In this chapter, the status of R&D investment in each country is studied using the data estimated by the OECD (referred to as “Japan (estimated by the OECD)” ) and others.
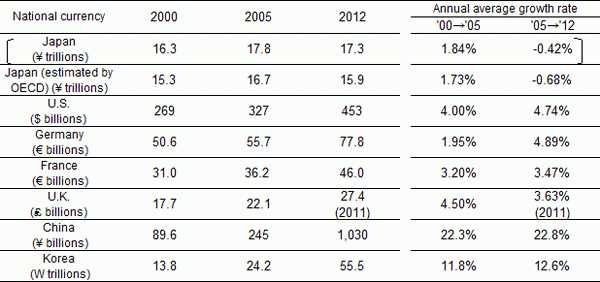
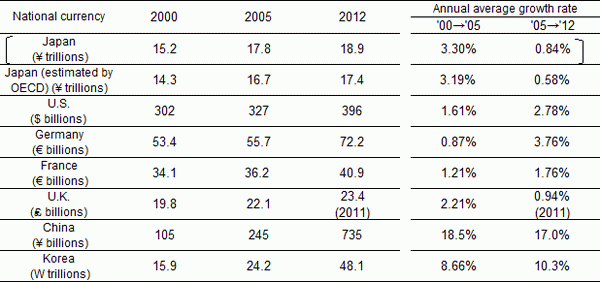
The total amounts of R&D expenditure in each country are shown in Chart 1-1-1. (A) is nominal values (in yen, of R&D expenditure representing each year's nominal price,) and (B) is real values (in yen, of R&D expenditure on the basis of the standard price values in 2005). (C) and (D) are the nominal values and real values (on 2005 base) represented by the national currencies of each country respectively.
Japan's total R&D expenditure (nominal value) was 17.3246 trillion yen (OECD estimate: 15.9 trillion yen) in FY 2012(2) (Chart 1-1-1 (A)). This was a decrease of 0.3% from the previous year and indicates that expenditure has remained mostly unchanged since 2009. Looking at the nominal values of each country for the latest available years, the U.S. has a much larger expenditure compared to the others. Its expenditure decreased temporarily in 2009, but has been increasing again since then.
China's expenditure surpassed Japan's in 2009 and is continuing to grow. Germany shows a continuing long-term growth trend. France and the U.K. have stayed at the same level since the mid-2000s, while Korea has recently shown an increasing trend. The EU's expenditure has stayed roughly the same in recent years. As for real values (Chart 1-1-1 (B)), the value for Japan has been growing since 2009. The same is true in the other countries.

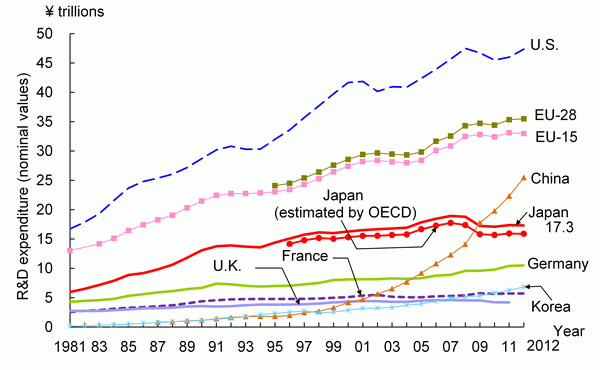
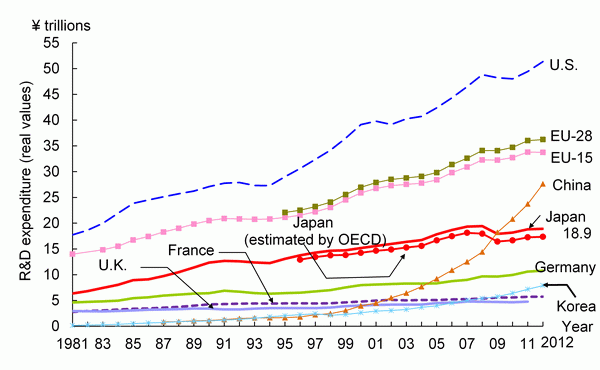
Chart 1-1-1 (C) shows a comparison of the investment status of each country in terms of the annual average growth rate of R&D expenditure during the first half of the 2000s (2000-2005) and the second half of the 2000s (2005 to the latest available year) on the basis of each national currency.
Comparing the annual average growth rate of R&D expenditure (nominal values) between the first half of the 2000s and the second half of the 2000s and thereafter, the growth rate was higher in the second half for the U.S., Germany, France, China and Korea. On the other hand, countries having weak growth in the second half of the 2000s were Japan and the U.K. Japan, in particular, had a negative annual average growth rate.
Chart 1-1-1 (D) shows annual average growth rates in (real) R&D expenditures on a 2005 base in order to eliminate the influence of price fluctuations. Growth was higher during the second half of the 2000s than in the first half in the U.S., Germany, France and Korea. Japan and the U.K. showed slower growth during the second half of the decade in real terms.
Note:
1) The total R&D expenditure is the sum of each sector's expenditure, and the definition of each sector occasionally differs depending on the country. Therefore it is necessary to be careful when making international comparisons. Refer to Chart 1-1-4 for the definition of sectors in each selected country.
2) R&D expenditure includes the field of social sciences and humanities (for Korea, only natural sciences until 2006)
3) The former West Germany until 1990, and the unified Germany since 1991, respectively.
4) Reference statistics E were used for the conversion to obtain purchasing power parity equivalent.
5) Real values were obtained by calculations with a GDP deflator (reference statistics D were used).
6) Value for Japan (estimated by the OECD) represents the total R&D expenditure in which the labor cost comprising a part of R&D expenditure in the university and college sector was converted to FTE. The value was corrected and estimated by the OECD.
7) Regarding the 2012 values, those for the U.S. are preliminary values, while those for Germany are national projections or estimated values that have been corrected by the Secretariat to accord, where necessary, with OECD standards. The values for France are provisional, while those for Japan (OECD) and the EU are OECD Secretariat estimates/projections based on each country's materials.
Source:
<Japan> Ministry of Internal Affairs and Communications, “Report on the Survey of Research and Development”
<U.S.> NSF, “National Patterns of R&D Resources 2011-12 Data Update”
<Germany> Bundesministerium fur Bildung und Forschung,“Bundesbericht Forschung 2004, 2006,” “Bundesbericht Forschung und Innovation 2010, 2012” ; from 2010: OECD,“Main Science and Technology Indicators 2013/2”
<Japan (estimated by the OECD), France and EU> OECD, “Main Science and Technology Indicators 2013/2”
<U.K> National Statistics website: www.statistics.gov.uk
<China> Ministry of Science and Technology of the People's Republic of China, S&T Statistics Data Book 2013 (website)
<Korea> National Science and Technology Information Service (website)
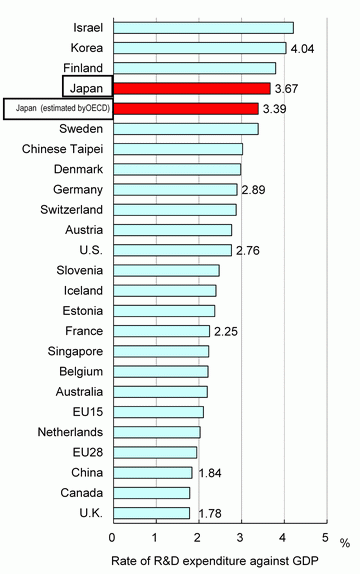
Next, the "ratio of total R&D expenditure against GDP (gross domestic product)" is shown below for comparison of R&D expenditures in light of the influence of the size of economy (Chart 1-1-2).
Japan's total R&D expenditure against GDP in 2011 could be described as being relatively high.
Note:
1) The value for Switzerland is from 2008, while that for Australia is from 2010.
2) The value for Israel excludes defense-related expenditure.
3) Values for the U.S. and Australia were prepared based on 2008SNA.
4) Capital expenditure in the U.S. was largely or entirely excluded.
5) OECD Secretariat estimates and projections based on national sources were used with regard to EU15 and 28.
6) Values for Australia are national projections or estimated values.
Source:
Same as for Chart 1-1-3. OECD, “Main Science and Technology Indicators 2013/2.”

Note:
The “attention to international comparison” and R&D expenditures are the same as those given in Chart 1-1-1. GDP is the same as for reference statistics C.
Source:
The details of the R&D values are the same as those given in the notes to Chart 1-1-1. GDP is the same as for reference statistics C.
Additionally, changes in the level of investment each country makes to R&D can be seen from changes in total R&D expenditure against GDP over the years (Chart 1-1-3).
Japan's ratio peaked in 2008 before entering a continuing declining trend. However, it showed an increase, albeit small, in 2011. In the most recent available year (2012), it remained at the same level as the previous year at 3.67%.
The statistic for Japan (estimated by the OECD) similarly peaked in 2008. The ratio for the latest available year (2012) is 3.36%.
The ratio for the U.S. was increasing from the mid-2000s but has been flat in recent years. Germany's ratio has been growing considerably since the mid-2000s. The ratios for France and the EU have remained largely unchanged in recent years. And growth of the U.K.'s ratio has been slowing since the mid-1990s. On the other hand, Korea's ratio has been growing rapidly since the 2000s. Its 2012 ratio was 4.4%, which is far higher than those of other countries.
In China, where economic development has been remarkable, the ratio has been increasing since 1996. The gap between China and the other selected coun-tries has shrunk markedly.
1.1.2 Trend of R&D expenditure by sector in each country
In order to understand national R&D systems, it is necessary to view by sector the institutions carrying out R&D activities in each country.
However, classification by sector and international comparison are problematic in that there are discrepancies among national R&D systems, methods of survey, and the scope of target organizations in each country. Consequently, comparison should be made in accordance with a correct understanding of the differences among each country.
This section classifies by sector the institutions in each country that perform R&D activities and examines the structure of R&D expenditure based on differences of each country.
Note:
Detailed information by sector for the U.K. and China was not obtained.
2) EU data are not included because they were available only as totals for each country.
<U.S.>
1) FFRDCs: Federally funded research and development centers
<Germany>
1) IfG: Institutions for co-operative industrial research and experimental development.
2) Funding sectors do not include "universities and colleges".
<China>Funding sectors do not include “universities and colleges.”
Sources:
NISTEP, “Metadata of R&D-related statistics in selected countries: Comparative study on the measurement methodology” (Research Material No. 143)
Ministry of Internal Affairs and Communications, “Report on the Survey of Research and Development”
BMBF, “Bundesbericht Forschung und Innovation 2008
(1) Definitions of funding and performing sectors in R&D expenditure
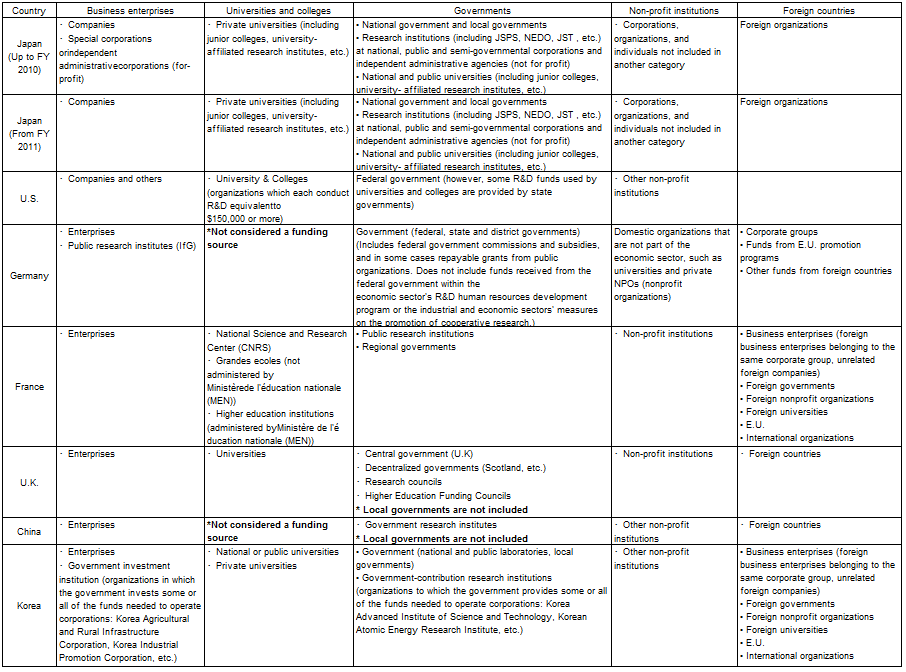
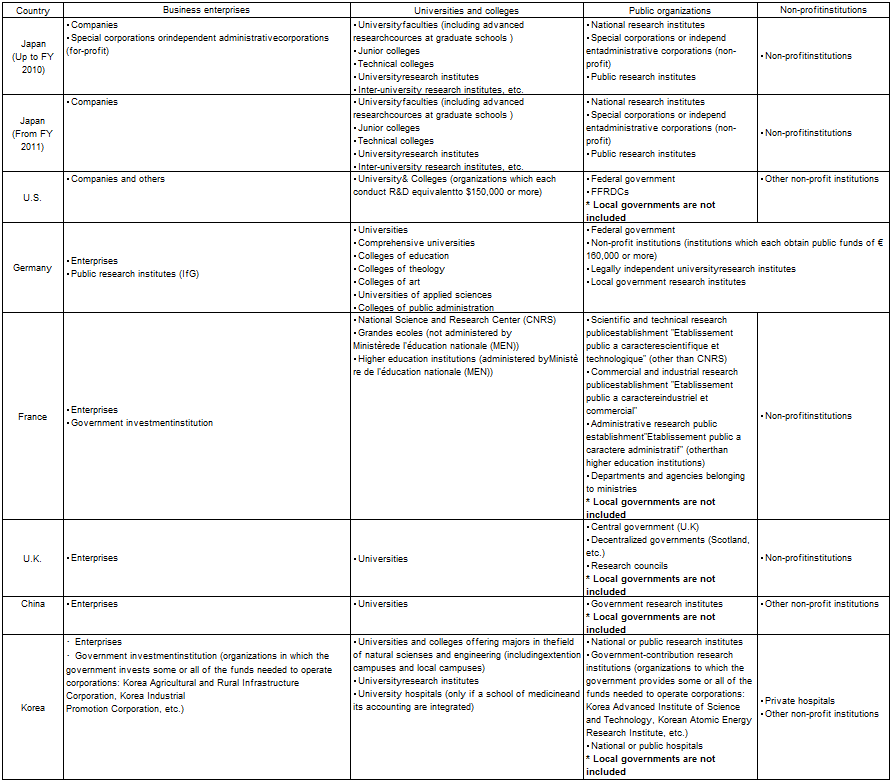
Chart 1-1-4 classifies institutions that perform R&D into sectors based on the OECD's "Frascati Manual"(3) It shows a simple breakdown of each country's R&D expenditure funding sectors (five sectors) and performing sectors (four sectors). Ex-pressions used in the chart are the same as those used in each country's R&D statistics or in OECD data; however the sector names of the headings are those used in a set of Japanese R&D statistics, the Survey of Research and Development of the Ministry of Internal Affairs and Communications.
(2) Funding sectors and performing sectors for R&D expenditures in selected countries
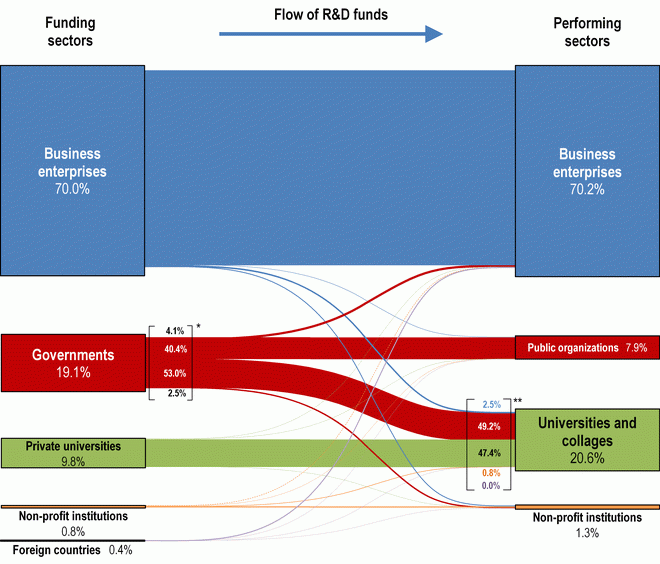
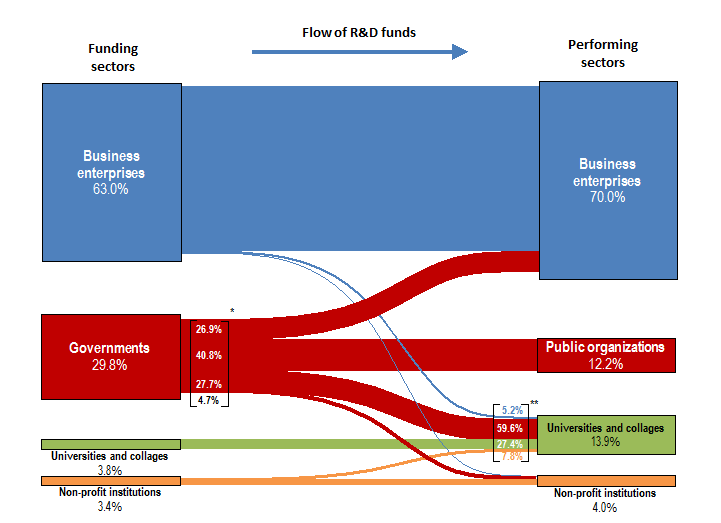
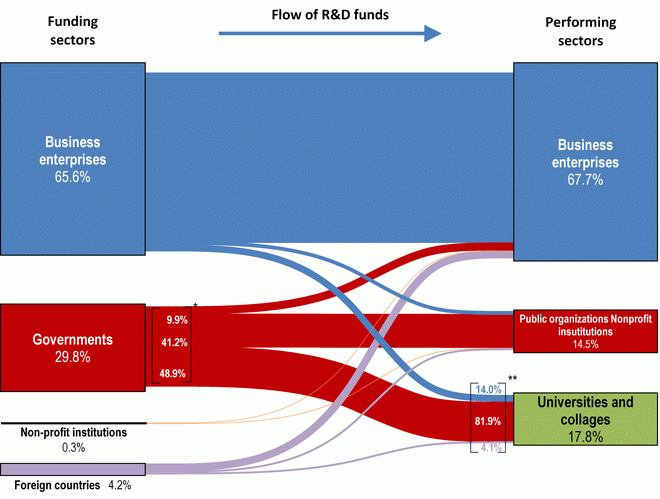
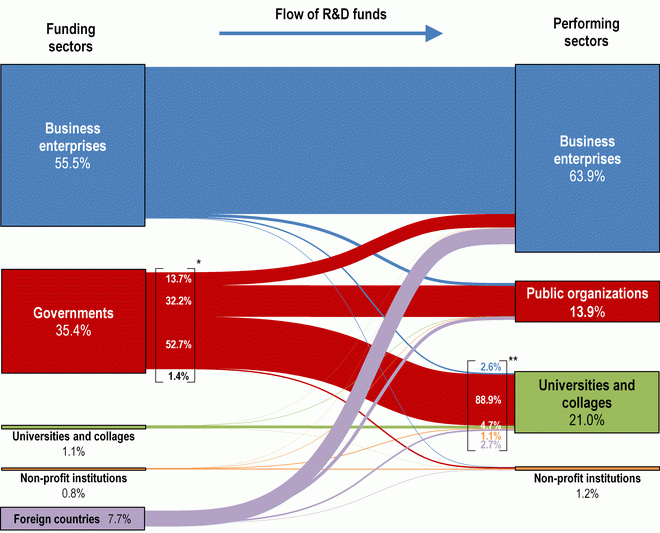
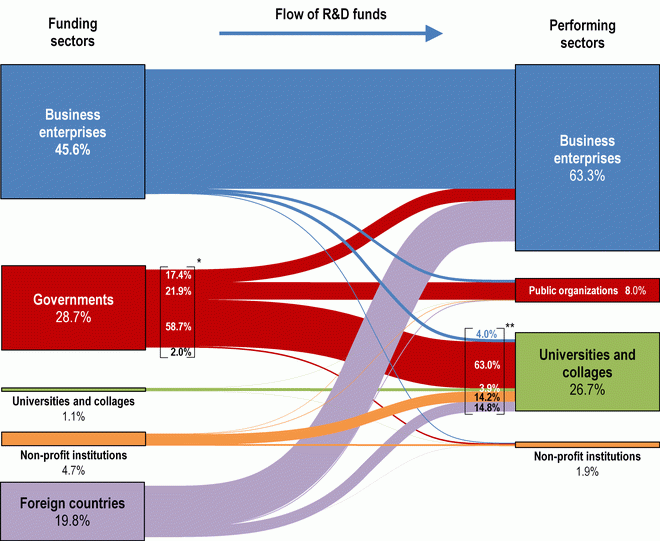
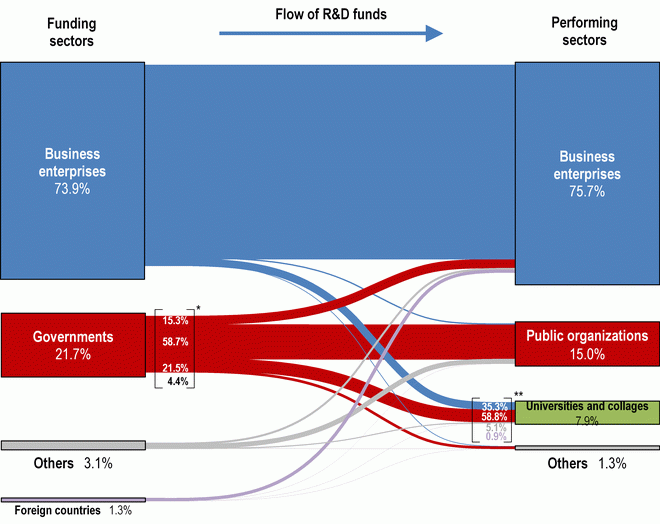
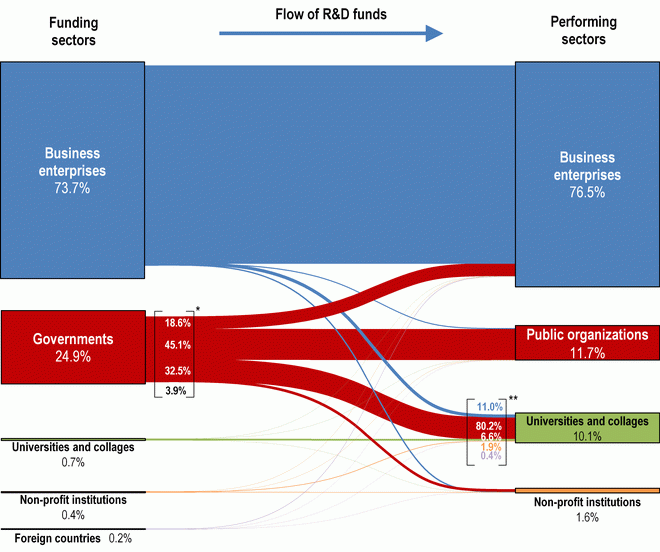
This section examines the flow of R&D funds from funding sectors to performing sectors in each country, how the funds are distributed, and which sectors use how much of them. Chart 1-1-5 shows each country's R&D expenditures divided by sector and their flow. Chart 1-1-4 above provides some details of the funding and performing sectors. However, caution is required because there is variation among the countries in terms of systems, survey methods, and the scope of the institutions covered, for both the funding sectors and the performing sectors.
Looking at the flow of R&D funds from funding sectors to performing sectors in each country, the business enterprises sector accounted for a large percentage in each country, but the flow was almost entirely within that same sector. In Germany and China, however, the flow of R&D funds to the universities and colleges sector was relatively larger.
In the case of the governments sector, many countries had flow to public organizations and universities and colleges. Countries with the largest flows to universities and colleges are Japan, Germany, France, and the U.K. In almost all of the countries, the flow from government to the business enterprises sector is small; however, in the case of the U.S., there are large flows to not only the public organizations and universities and colleges sectors but also to the business enterprises sector.
The universities and colleges sector is extremely small as a funding sector. In particular, in Germany and China, universities and colleges are not assumed to form a funding sector. In Japan's case, the only universities included in “universities and colleges” as a funding sector are private universities. The funding share of universities and colleges in Japan is large compared to other countries. The major reason for this is that a certain percentage of personnel expenses for instructors at private universities and colleges is statistically considered to be R&D expenditure.
The percentage of funding provided by the non-profit institutions sector was small in each country.
The foreign countries sector has a relatively large funding share in both the U.K. and France. In both those countries, most of those funds flowed to the business enterprises sector. It should be noted that, in the case of the United States, “foreign countries” is not classified as a funding sector.
Looking at each country, Japan had a large flow of R&D funds from the business enterprises sector to the business enterprises sector. There was almost no flow from that sector to other sectors. There was a large flow from the governments sector to the universities and colleges sector and to the public organizations sector as well. As was mentioned above, as a funding sector, the universities and colleges sector refers to private universities. All those funds flow to the universities and colleges sector as the performing sector. However, this flow means that R&D expenditure in private universities is almost entirely self-funded.
In the U.S., there was a large flow of R&D funds from the business enterprises sector to the business enterprises sector. While there was also a large flow from the governments sector to the public organizations sector, the flow from that sector to the business enterprises sector was also large, equaling the size of the flow to the universities and colleges sector.
In Germany, as in the other countries, the flow between the business enterprises sectors was the mainstream. Compared with the other countries, however, Germany had one of the larger flows of R&D funds to the universities and colleges sector and the public organizations/non-profit institutions sector. It had the largest flow from the business enterprises sector to the universities and colleges sector of any of the selected countries. The share of funds accounted for by the foreign countries” sector was also among the largest.
Likewise in France, the flow from business enterprises was the largest, followed by governments. In particular, France is characteristic in that the funding share of governments is the largest compared to the other countries at 35.4%. The foreign countries sector's share of funding was also relatively large. Most of those R&D funds flowed to the business enterprises sector.
A characteristic of the U.K. is that the share of foreign countries has an exceptionally large compared to the other countries of 19.8%. Furthermore, most R&D funds from the foreign countries sector flowed to the business enterprises sector, but a large share also went to the universities and colleges sector. Among the funding sectors, the business enterprises sector has a share of 45.6%, which is small compared to the other countries; however, its share among the performing sectors stands at 63.3%.
In China, the non-profit institutions sector comes under the classification “other.” At 73.9%, the share of business enterprises is large even when compared to other countries. Although almost all flows to business enterprises, the portion to universities and colleges is also large and funds 35.3% of their R&D expenditure. The largest share of R&D funding borne by the governments sector flowed to the public organizations sector.
In Korea, the funding share of the business enterprises sector is large at 73.7%. Almost all flows to business enterprises. The governments sector's share was large at 24.9%. About half of that went to the public organizations sector.

(A) Japan (FY 2012)
*U.S. funding sectors do not include "foreign countries."
Notes :
1) See Chart 1-1-4 regarding funding and performing sectors.
2) * = Analyzed in detail in Chart 1-2-5.
3) ** = Analyzed in detail in Chart 1-3-15.
4) Values for the U.S. are preliminary.
Source:
<Japan> Ministry of Internal Affairs and Communications, “Report on the Survey of Research and Development”
<U.S.> NSF, “National Patterns of R&D Resources 2011-12 Data Update”
<U.K> National Statistics website: www.statistics.gov.uk
<Germany, France, Korea> OECD,“Research & Development Statistics 2013”
<China> Ministry of Science and Technology of the People's Republic of China, "China Science and Technology Indicators"
(3) Changes in R&D expenditures in performing sectors in selected countries
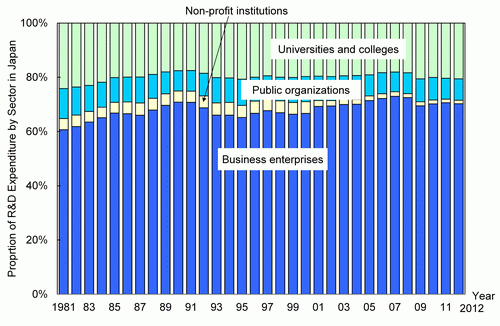
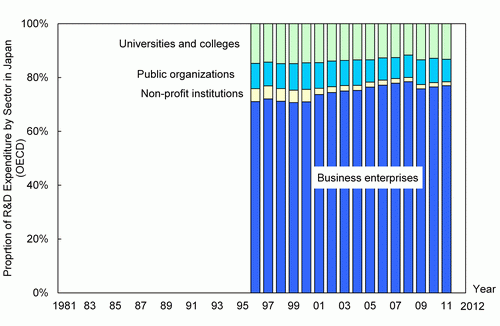
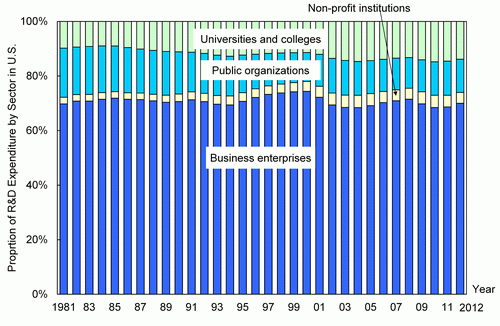
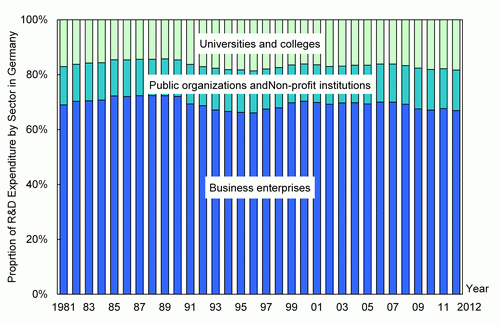
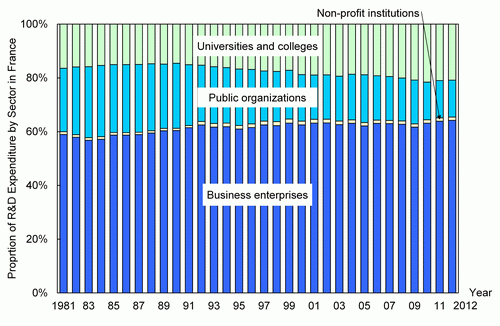
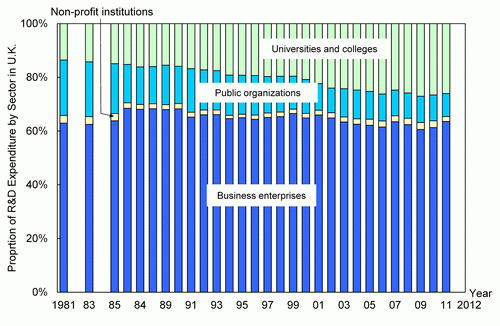
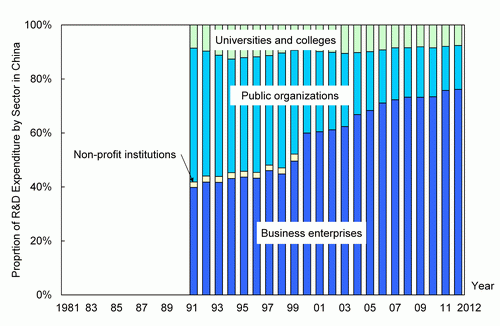
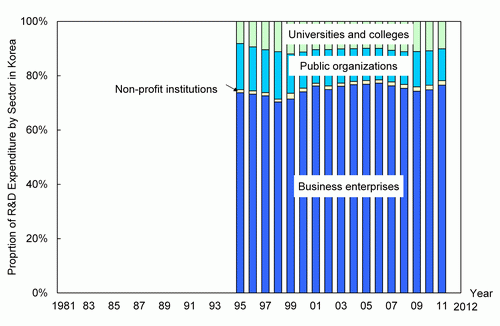
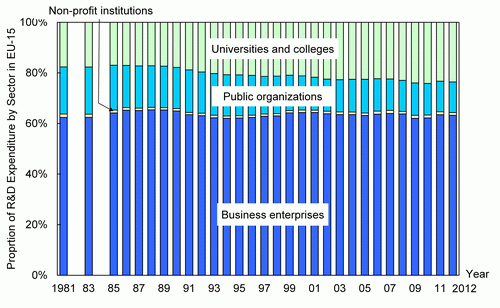
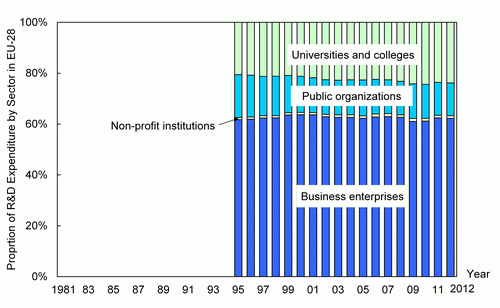
In Chart 1-1-6, each selected country's total R&D expenditure is classified by sector, and changes in the proportions of each sector are shown. In each country, the business enterprises sector accounted for the largest proportion of total R&D expenditure; its share was about 70% in Japan, the U.S., and Germany. However, France and the U.K. tend to be slightly lower in comparison with the above countries, with shares of about 60%. In China, the business enterprises sector accounted for roughly 40% in the early 1990; however, its share has been increasing and has been around 80% in recent years. The sector's share in Korea is also around 80%.
As for specific countries and regions, a long-term look at Japan shows that the business enterprises sector continues to increase while the public organizations sector is showing a gradual decrease. However, since 2009, the share of business enterprises has been decreasing while that of the universities and colleges sector is increasing. The significant decrease in the non-profit institutions sector since FY 2001 was due to a change in classification method for statistics.
Looking at Japan (estimated by OECD), the share of the universities and colleges sector is small compared to Japan data because R&D expenditure arrived at by converting labor costs in the universities and colleges sector to FTE are used. However, the same trend is evident in changes in other sectors.
In the U.S., from a long run perspective, the proportion for the public organizations sector has been on the decrease, while the non-profit institutions sector has been small but increasing. The proportion of R&D expenditure of the universities and colleges sector is showing a gradual increasing trend over the long term.
In Germany, the data of public organizations sector and the non-profit institutions sector are integrated because these have not been classified. No major fluctuation is seen in this sector's proportion of R&D expenditure over time, and thus it is thought that changes in the business enterprises and universities and colleges sectors are having an impact on conditions. In recent years, the proportion of the universities and colleges sector has been increasing, while that of the business enterprises sector has been decreasing.
In France, the proportion of the public organizations sector is always relatively large. This proportion has been decreasing in the long term and has recently leveled off. At the same time, the proportion of the universities and colleges sector is in an increasing trend.
In the U.K., the proportion of R&D expenditure of the public organizations sector has been decreasing since the 1990s, while that of the universities and colleges sector had been increasing; however, the latter sector's share flattened out in the mid-2000s.
In China, the public organizations sector's share had been around 50%, but has been decreasing since 1999. On the other hand, the proportion of the business enterprises sector is rising and has accounted for at least 70% in recent years.
In Korea, the proportion of the public organizations sector is larger than that of the universities and colleges sector. The proportions of both sectors have remained largely unchanged in recent years.
EU-15 and 28 show the same characteristics as the U.K. and France. Specifically, the proportion of the public organization sector is in a long-term decreasing trend, while the proportion of the universities and colleges sector is showing an increasing trend.

 (A) Japan
 (B) Japan (estimated by OECD)
Note:
1) The total R&D expenditure is the sum of each sector's expenditure, and the definition of each sector occasionally differs depending on the country. Therefore it is necessary to be careful when making international comparisons. Refer to Chart 1-1-4 for the definition of sectors in each selected country.
2) R&D expenditure includes the field of social sciences and humanities (for Korea, only natural sciences until 2006)
3) For Japan (OECD estimate), France, China, Korea and EU, non-profit institution totals minus the business enterprises; public organizations; and universities and colleges.
4) Regarding the 2012 values, those for the U.S. are preliminary values, while those for Germany are national projections or estimated values that have been corrected by the Secretariat to accord, where necessary, with OECD standards. The values for France are provisional, while those for Japan (OECD) and the EU are OECD Secretariat estimates/projections based on each country's materials.
<Japan and Japan (OECD estimate)> In 2001, part of non-profit institutions was moved to the business enterprise sector.
<Japan (estimated by the OECD)> From 1996, figures corrected and estimated by the OECD (R&D expenditure in the universities and colleges sector comprising labor costs converted to FTE) are used, so caution is required when viewing changes over time.
<Germany> Former West Germany until 1990, and the unified Germany since 1991, respectively.
Source:
<Japan> Ministry of Internal Affairs and Communications, “Report on the Survey of Research and Development” ; OECD, “Main Science and Technology Indicators 2013/2”
<U.S.> NSF, “National Patterns of R&D Resources 2011-12 Data Update”
<Germany> Bundesministerium fur Bildung und Forschung,“Bundesbericht Forschung 2004, 2006,” “Bundesbericht Forschung und Innovation 2010, 2012” ; from 2010: OECD,“Main Science and Technology Indicators 2013/2”
<U.K> National Statistics website: www.statistics.gov.uk
<France, China, Korea and EU> OECD, “Main Science and Technology Indicators 2013/2”
(1) The Organization for Economic Co-operation and Development (OECD) is an organization in which countries supporting democracy and market economy engage in activities for the purpose of 1) economic development, 2) aid to developing countries and 3) expansion of multilateral free trading. OECD is currently composed of 34 member countries. It gathers internationally comparable statistics, economic and social data, and also conducts prediction and analysis.
(2) Since the period covered to collect yearly total domestic R&D expenditure data differs depending on the country, this report in principle uses the calendar year for international comparison. However, an exception is made when discussing Japan, as "fiscal year" is used.
(3) Frascati Manual 2002 (Proposed Standard Practice for Surveys on Research and Experimental Development)
International standards with regard to the method of surveying R&D statistics are stated in this manual. In 1963, a meeting on surveying research and experimental development (R&D) in Frascati, Italy was held by experts from member countries of the OECD. The summary of the result is the proposed standard practice for surveying research and experimental development. The latest publication was the sixth version (2002). Most surveys of R&D statistics in each country are mainly conducted following this manual.


