5.2 High-technology industry trade and medium high-technology industry trade
Key points
- Looking at high-technology industry trade of the selected countries, China is seeing rapid growth. Since the second half of the 2000s, China's high-technology industry exports have surpassed those of the U.S.; its imports also surpassed those of the U.S. in 2012.
- Japan's high-technology industry trade was running large surpluses in the second half of the 1990s. However, its exports flattened out upon entering the 2000s, while its imports continue to grow. Japan has an export surplus in “radio, television, and communication equipment” ; however, this surplus is shrinking. Both “Aircraft and Spacecraft” and “Pharmaceuticals” consistently show import surpluses.
- Looking at Japan's high-technology industrial competitiveness, Japan's balance ratio was 0.94 in 2012, a figure that fell below 1 and marked Japan's first import surplus.
- Japan's medium-high technology trade balance ratio in 2013 was 3.04, which ranked number one among the selected countries. Looking at trends, Japan showed a rapid decline in the mid-1990s followed by a gradual decrease; however, its export surplus is still larger than the other countries.
(1) High-technology industry trade
The trade amount of high-technology industries is not data regarding direct exchanges of science and technology knowledge in the sense that technology trade is. However, it is an indirect indicator of science and technology knowledge that has been applied to the development of actual products. High-technology industries as used herein are based on definitions used by the OECD (they are sometimes called “R&D intensive industries” ). In last year's Japanese Science and Technology Indicators 2013, five industries were classified as high-technology industries. However, in line with a revision to the International Standard Industry Classifications (ISIC) by the OECD (ISIC Rev.3→ISIC Rev.4), this number was scaled down to three industries; namely, “pharmaceuticals,” “radio, television, and communication equipment,” and “aircraft and spacecraft.” The reader is therefore advised to note that industry classifications differ from those used in last year's version.
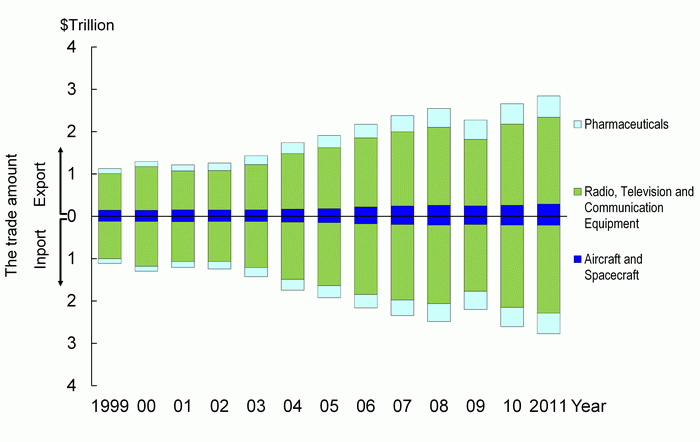
Focusing on 34 OECD member-countries and 7 non-OECD countries and regions(3), the Chart 5-2-1 shows changes in the total amount of the trade amount(4) (export amount and import amount) of high-technology industry is shown. This is considered high-technology industry trade for the entire world. From this, it can be seen that the scale of high-technology industry trade shrank in 2009 but grew in 2010 and 2011. A breakdown of all industries shows that “radio, regarding Television and Communication Equipment” accounts for the largest share of trade at about 70%.
Note:
The non-member countries and regions are Algeria, China, Russia, Singapore, Romania, South Africa and Taiwan.
Source:
OECD, “ Main Science and Technology Indicators 2013/2”
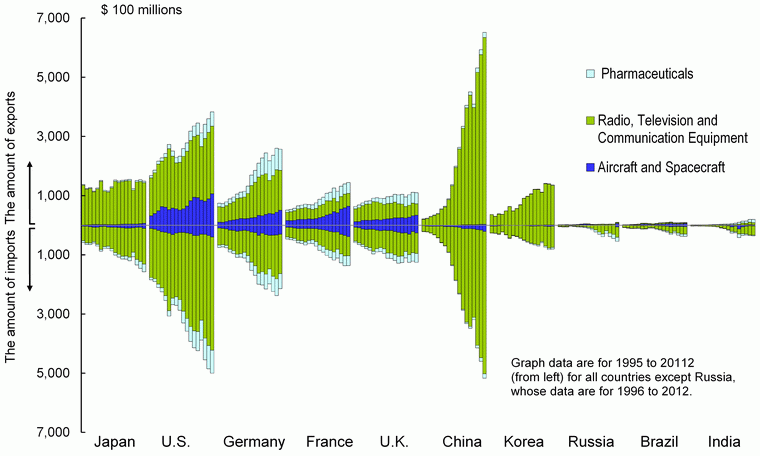
Chart 5-2-2 shows the change in the trade balance of the entire high-technology industry. Looking at this chart, it is obvious that China is seeing rapid growth. Since the second half of the 2000s, China's high-technology industry exports have surpassed those of the U.S.; its imports also surpassed those of the U.S. in 2012.
Looking at the situation by country, Japan's high-technology industry trade was running large surpluses in the second half of the 1990s. However, its exports flattened out upon entering the 2000s, while its imports continue to grow. Japan has an export surplus in “radio, television, and communication equipment” ; however, this surplus is shrinking. Both “aircraft and spacecraft” and “pharmaceuticals” consistently show import surpluses.
The U.S. has seen growing exports and imports in its high-technology industry trade. However, entering the 2000s, the U.S.'s imports came to greatly exceed its exports, and a trade deficit continues. The U.S. has import surpluses in “radio, television and communication equipment” and “pharmaceuticals,” and a large export surplus in “aircraft and spacecraft.”
Germany's high-technology industry trade amount is increasing; it surpassed that of Japan in the early 2000s. Although its trade amount in “radio, television and communication equipment is large, it maintains a balanced ratio. Additionally, it has a large export surplus in pharmaceuticals as well as an export surplus in “aircraft and spacecraft.”
France had an export amount in “aircraft and spacecraft,” for which it also had a high trade balance ratio. It also had an export surplus in “pharmaceuticals.”
The U.K.'s exports flattened out upon entering the 2000s, and its imports flattened have out from the second half of the 2000s. While the U.K. has an export surplus in “pharmaceuticals,” it has an import surplus in “radio, television and communication equipment” and thus its trade deficit is growing.
China's high-technology industry trade is growing remarkably in terms of both exports and imports. China's exports surpassed those of the U.S. in the second half of the 2000s and continue to grow. In particular, China's exports of “radio, television and communication equipment” are growing remarkably.
Korea's high-technology industry trade is growing in terms of both exports and imports. Its exports are growing particularly strongly, with conspicuously strong growth in “radio, television and communication equipment.”
Looking at data for the BRICs countries, which have seen remarkable economic growth in recent years, Russia, Brazil, and India are all enjoying significant growth in their imports. Russia has an export surplus in “aircraft and spacecraft.” Brazil's only export surplus is in “aircraft and spacecraft.” India is showing remarkable growth in its exports in “pharmaceuticals” and has a growing trade surplus.
Sources:
<Japan, U.S., Germany, France, U.K., China, Korea, Russia> OECD, “Main Science and Technology Indicators 2013/2”
<Brazil and India> OECD, “STAN Bilateral Trade in Goods by Industry and End-use (BTDIxE), ISIC Rev. 4”
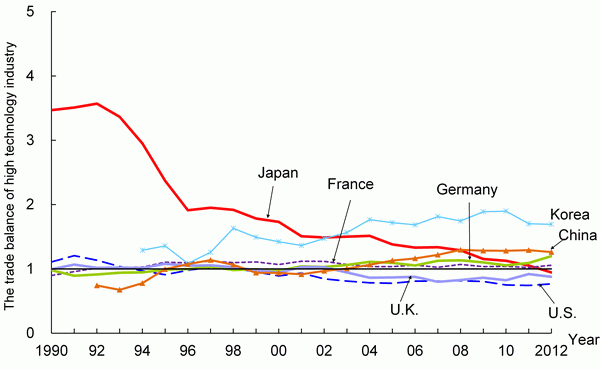
Chart 5-2-3 shows changes in the overall trade balance ratios for high-technology industries. Japan's balance ratio was 0.94 in 2012, a figure that fell below 1 and marked Japan's first import surplus.
The U.S.'s balance ratio has been fluctuating around 1 but began declining around 2000. It stood at 0.77 in 2011. Germany, France and the U.K. had had balanced trade balance ratios when viewed over the long term; however, the U.K.'s ratio fell below 1 upon entering the 2000s and is continuing a downward trend. On the other hand, Germany's ratio is above 1. Additionally, the trade balance ratios of China and Korea have been showing long-term increases. Korea has the highest ratio among the selected countries.
Source:
Same as for Chart 5-2-2.
(2) Medium high-technology industry trade
Ascertaining the circumstances of medium high-technology industry trade is just as important as ascertaining those of high-technology industry trade.
“Medium high-technology industry” as it is used here is based on the definition used by the OECD. Specifically, it is comprised of “chemicals (excluding pharmaceuticals),” “machinery & equipment,” “electrical machinery and apparatus (excluding telecommunications equipment),” “motor vehicles, trailers and semi-trailers,” and “railroad equipment and transport equipment.”
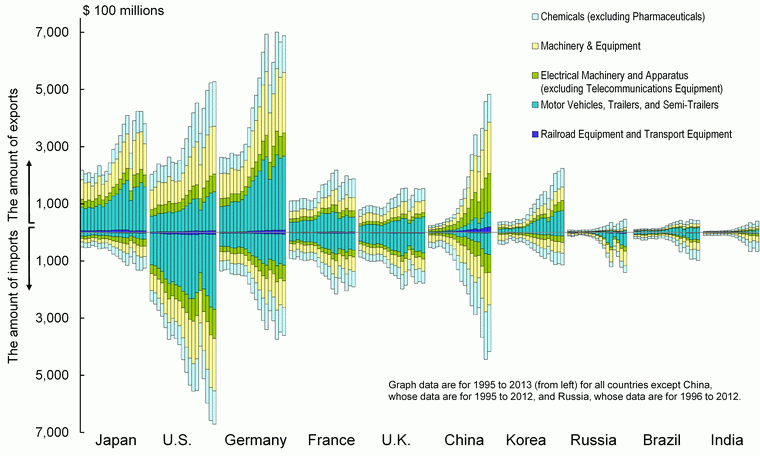
Looking at Chart 5-2-4, Germany has the highest exports in medium high-technology industry trade, followed by the U.S. Japan also has a presence, although China's exports exceeded those of Japan in recent years.
On the other hand, the U.S. has the highest import amount. Germany also has a large amount, but has been surpassed by China in recent years.
Looking at individual countries, Japan's exports have been growing rapidly since the mid-2000s, with large shares in “motor vehicles, trailers and semi-trailers” and “machinery & equipment.”
As for the U.S., “motor vehicles, trailers and semi-trailers” stands out in its amount of imports.
In the case of Germany, “motor vehicles, trailers and semi-trailers” has the largest share of exports, although “machinery & equipment” has also been growing rapidly since the mid-2000s.
For France, “motor vehicles, trailers and semi-trailers” had the largest share of exports; however “chemicals (excluding pharmaceuticals)” has surpassed it in recent years. The trend in the U.K. has been opposite of that in France.
As for China, “machinery & equipment” and “electrical machinery and apparatus (excluding telecommunications equipment)” are increasing rapidly in exports, while “chemicals (excluding pharmaceuticals)” is increasing rapidly in imports.
In Korea, “motor vehicles, trailers and semi-trailers” and “chemicals (excluding pharmaceuticals)” are growing considerably in exports.
Russia, Brazil, and India have smaller amounts than the other countries. They also have import surpluses.
Source:
OECD, “STAN Bilateral Trade in Goods by Industry and End-use (BTDIxE), ISIC Rev. 3”
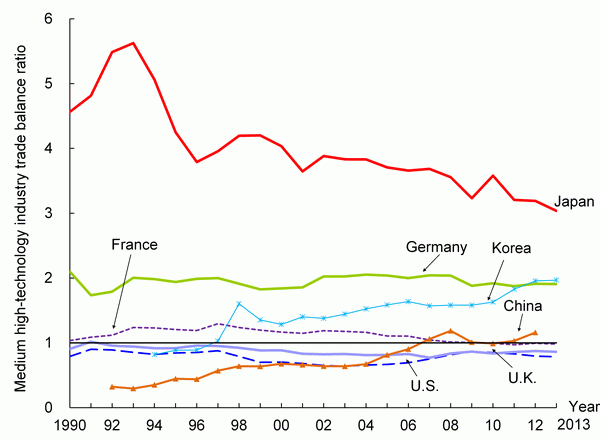
Chart 5-2-5 shows changes in the overall trade balance ratios for medium high-technology industries.
Japan's medium-high technology trade balance ratio in 2013 was 3.04, which ranked number one among the selected countries. Looking at trends, Japan showed a rapid decline in the mid-1990s followed by a gradual decrease; however, its export surplus is still larger than the other countries.
Following is Korea, which has seen long-term increases in its balance ratio. In 2013 it stood at 1.97.
Germany had a balance ratio of 1.91 in 2013. Its ratio has remained roughly unchanged and is producing sustained export surpluses.
China's balance ratio has been increasing when viewed over the long term. China achieved an export surplus in the second half of the 2000s. France's balance ratio has fluctuated around 1.0 and shown no significant movement even when viewed over the long term.
The U.K.'s balance ratio has shown an import surplus each year with the exception of 1991.
The U.S.'s balance ratio has yet to climb above 1.
Source:
Same as for Chart 5-2-4.
(3) Algeria, China, Russia, Singapore, Romania, South Africa and Taiwan
(4) Summed up the amount which each country trades with other countries.

