In recent years, there has been a strong need for initiatives that link the results of science and technology to the creation of new value through innovation. Indicators that can show the influence of science and technology on innovation have therefore become important. At this point, however, it is difficult to grasp such influence, and there is little quantitative data.
In this chapter, indicators of high-technology industry trade and medium high-technology industry trade, which give a comprehensive picture of technology trade and R&D-intensive industry showing international technological competitiveness, are examined. Next, using data on trademarks and patent families, the state of innovation in each of the countries will be considered. In addition, a comparison of the innovation activities of Japanese and the U.S. business enterprises is made based on surveys of businesses in those countries. Finally, long-term changes in Total Factor Productivity (TFP), which is frequently used as a proxy for the outcome of innovation, are examined.
5.1 Technology trade
Key points
- Japan's technology trade balance has been increasing since it exceeded 1 for the first time in 1993; FY 2012 marked a high figure of 6.1.
- Looking at technology trade exclusive of that between parent companies and subsidiaries, Japan's technical trade balance in 2012 was 2.0. It has had an export surplus since 2006. In the U.S., the balance was 4.0.
5.1.1 International comparison of technology trade
In general, technology exports means that the right to use a technology(1) is given to business enterprises or individuals located in or having residence overseas in exchange for payment, and technology imports (technology introduction) means that the right to use a technology is received from business enterprises or individuals located in or having residence overseas in exchange for payment. This is called technology trade. Amount of technology trade, which illustrates the conditions of international trade of technical knowledge, is used as an indicator for international measurement of countries' technology levels. Specifically, the ratio of technology exports (receipts) to technology imports (payments), i.e., the technical trade balance, is used as an indicator that reflects technology strength. Because situations and conditions for technology trade differ in each country, simple comparisons are impossible. The focus here is therefore on changes over time and the correlation between the amounts of technology imports and exports for each country.
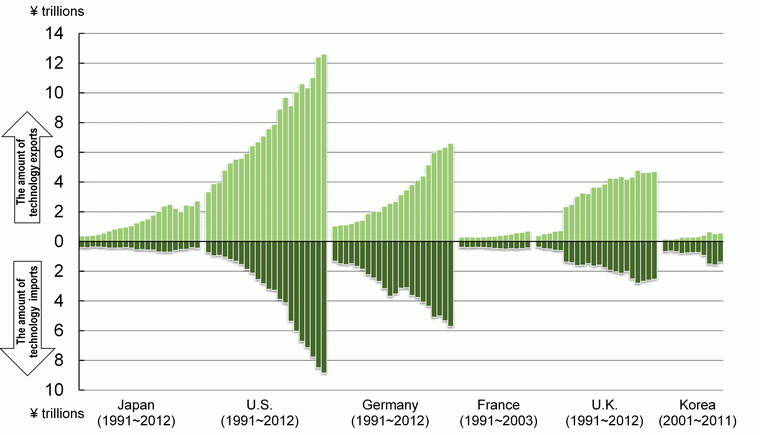
Looking at the amount of the technology trade in major countries (Chart 5-1-1 (A)), the trend for each country is not the same; however, it has generally been increasing on the whole. Looking at specific countries, the amount of technology exports for Japan is higher than that of its technology imports. The amount of technology exports was approximately 2.721 trillion yen and that of technology imports was about 448.6 billion yen in 2012. The amount of technology imports had been decreasing since peaking in FY 2007; however, it moved up again in 2012.
The U.S. has by far the world's largest technology export amount. In 2012, it was approximately five times that of Japan. Additionally, looking at long-term trends, both technology imports and exports are growing. However, its technology imports are smaller than its technology exports.
In Germany, both the amounts of both technology exports and imports greatly exceeds that those of Japan. Additionally, looking at long-term trends over time, both technology imports and exports are growing.
Of the countries in the chart, France is one of among the countries which that have a small amounts of for both technology exports and technology imports. Looking at change over time, its amount of technology exports has tended to increase since the 1990s, while its amount of technology imports has remained flat. (Note that the most recent year for which French statistics were available is 2003.)
Regarding the U.K., caution is necessary when looking at change over time because the methods of gathering statistics changed in 1996 and again in 2009. Nevertheless, the amount of technology exports has tended to be flat in recent years.
In the case of Korea, the amount of technology imports is substantially larger than that for technology exports.
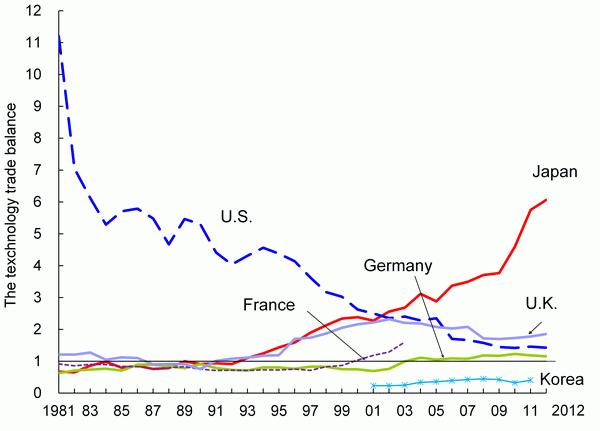
Looking at the technology trade balance (the amount of technology exports/the amount of technology imports) (Chart 5-1-1 (B)), the technology trade balance of Japan has increased continuously since it exceeded 1 in 1993; in 2012, it marked a high figure of 6.1.
The technology trade balance of the U.S. is tending to decrease in the long run. It has been below that of Japan since 2002. The U.S. had an export surplus of 1.4 in 2011.
The technology trade balance of Germany passed 1 in 2003, and has been gradually increasing since then.
That of France was over 1 for the first time in 2000; France has an export surplus since then. France has posted high figures in subsequent years, and marked 1.6 in 2003.
The technology trade balance of the U.K. has grown smoothly since entering the 1990s and consistently shown export surpluses since 1996. However, this growth slowed from around the mid-2000s and has been trending flat in recent years. Korea continues to have an import surplus.
(A) Technology trade amount trends
Note :
<Japan> Data are for fiscal years.
The sorts of technology trade are as follows (excluding trademark rights):
(1) Patent rights, utility model rights and copy rights
(2) Design rights
(3) Each kind of technological know-how provision and technical guidance (excluding free provision)
(4) Technological aid for developing countries (including government-commissioned works)
<U.S.> Through 2000, only royalties and licenses. For 2001-2005, research, development and testing services were added. Since 2006, intangible assets (excluding books, records, television, films, etc), computers, data processing services, etc., have been included. Figures for 2011 are provisional.
<Germany> West Germany until 1990. Until 1985 includes patents, licenses, know-how, trademarks, and design. From 1986, additionally included technical services, computer services and R&D in industrial fields. Figures for 2011 are provisional.
<U.K> From 1996, includes patents, inventions, licenses, trademarks, design and services and R&D related to technology. Data continuity with the previous year is impaired for 2009. Figures for 2011 are provisional.
<Korea> Figures for 2009 are provisional.
Statistical reference E was used for purchasing power parity conversion.
Source :
<Japan> Ministry of Internal Affairs and Communications, “Report on the Survey of Research and Development.”
<U.S., Germany, France, U.K. and Korea>
OECD, “Main Science and Technology Indicators 2013/2.”
When the data on technology trade is looked at, it can be seen that a significant ratio of technology trade among nations is accounted for technology transfers within corporate groups such as technology trade with affiliated companies overseas. Technology trade with affiliated companies is an indicator for international transfer of technical knowledge; however, it is not a strong indicator for the international competitiveness of technological strength. When technology trade is used as an indicator for seeing each country's technological strength, it is better to consider it by excluding technology transfers within corporate groups. Thus, regarding the amount of technology exports and imports of Japan and the U.S. whose data it is available, technology trade between affiliated companies and that between other companies are compared.
In Japan's survey (2) , the term “parent companies and subsidiaries” is applied when the controlling share is over 50% in the capital ties between technology exporters and importers. With this definition, technology trade among parent companies and subsidiaries and that among other companies are surveyed.
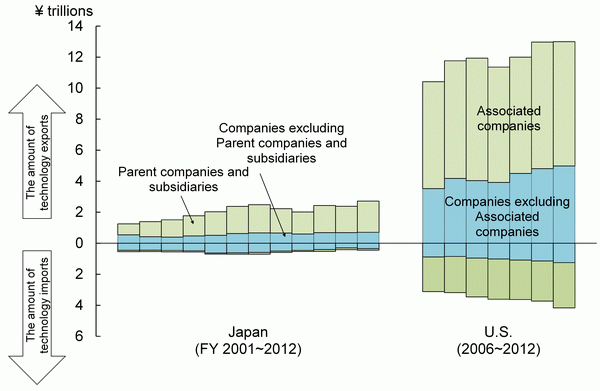
As shown in Chart 5-1-2 (A), Japan's technology exports, excluding those between parent companies and subsidiaries, were 704.3 billion yen in FY2012, accounting for 25.9% of the whole. In FY 2001, they accounted for 43.3% of the total. Compared with FY 2012, technology exports exclusive of trade between parent companies and subsidiaries decreased by 17.4 percentage points. However, the amount of technology imports excluding that between parent companies and subsidiaries was 344.6 billion yen in FY 2012. It accounted for 76.8% of the total. This figure has declined by 5.8 percentage points since FY 2001.
In the data for the U.S., technology trade of “associated companies” is defined as companies which own directly or indirectly 10% or more of voting rights or shares.
The amount of technology exports of companies excluding associated companies in 2012 was 4.9777 trillion yen, accounting for 38.3% of the technology exports total.
Regarding the amount of technology imports, technology imports of companies excluding associated companies were about 1.2508 trillion yen in 2012, accounting for 30.0% of the total.
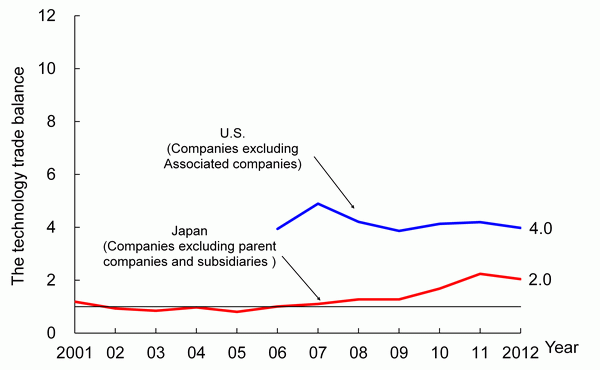
Next, looking at the technology trade balance of companies excluding parent companies, subsidiaries and affiliates (Chart 5-1-2 (B)), Japan had fluctuated around 1 but rose to 2.0 in 2012. This result can be interpreted as indicating that Japan's relative technical competitiveness has improved. However, declining technology imports are more of a factor here than increasing technology exports.
The U.S. has been fluctuating around 4 and stood at 4.0 in 2012.
Since definitions for parent companies and subsidiaries in Japan or associated companies in the U.S. are different, a simple comparison cannot be made. However, the data indicates that the technological strength of the U.S. surpasses that of Japan (See Chart 5-1-2(C) for definitions of parent companies and subsidiaries in Japan and the U.S.).

(A) The amount of technology trade
(Technology trade of companies excluding parent companies, subsidiaries and affiliates)
by capital ties, and the amount of technology trade

Note:
Attention should be paid to when international comparisons are done, because definitions for parent companies and subsidiaries (affiliated companies) are different in Japan and in the U.S. Differences are as follows:
1) Japan's parent companies and subsidiaries are companies whose controlling share is over 50%.
2) U.S.'s associated companies are companies which own directly or indirectly 10% or more voting rights or shares.
<Japan> Types of technology are the same as in Chart 5-1-1.
<U.S.> Types of technology trade are royalties and licenses only.
Source:
<Japan> Ministry of Internal Affairs and Communications, “Report on the Survey of Research and Development.”
<U.S.> U.S. Department of Commerce, Bureau of Economic Analysis, U.S. International Services
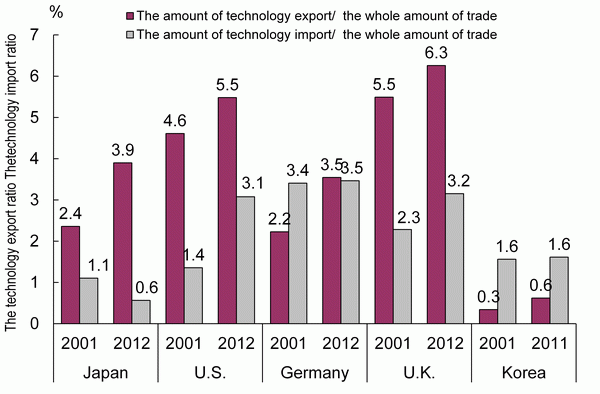
Chart 5-1-3 is the ratio of the amount of the technology trade against the whole amount of trade. The level of the amount of the technology trade is shown by comparison with the entire trade amount of goods and services. Hereinafter, the ratio of the amount of technology exports which it occupies out of total exports is called the “Technology export ratio,” and that for technology imports is called the “Technology import ratio.”
The U.K. had the highest technology export ratio, at 6.3% in 2012. Its 2001 figure of 5.5% was also high. In comparison, this was an increase of 0.8 percentage points. The second-highest was the U.S. at 5.5% in 2012. This was a 0.9 point increase from its 2001 figure of 4.6%.
Japan's technology export ratio in 2012 was 3.9%, which was an increase of 1.5 points over the 2001 figure (2.4%).
Looking at technology import ratio, Germany (3.5% in 2012) and the U.K. (3.2% in 2012) posted high ratios. Compared to 2001, the U.K.'s ratio has increased while Germany's is largely unchanged. The U.S.'s ratio stood at 3.1% in 2012, which was roughly double its ratio in 2001 (1.4%).
Japan's technology import ratio in 2001 was 1.1%; by 2012, it had fallen to 0.6%, or roughly half the 2001 figure.
Note:
The amount of technology imports and exports is the same as in Chart 5-1-1.
Source:
<The amount of technology imports and exports> is the same as in Chart 5-1-1.
<The amount of the whole imports and exports>, OECD, “Aggregate National Accounts
5.1.2 The Technology Trade of Japan
Key points
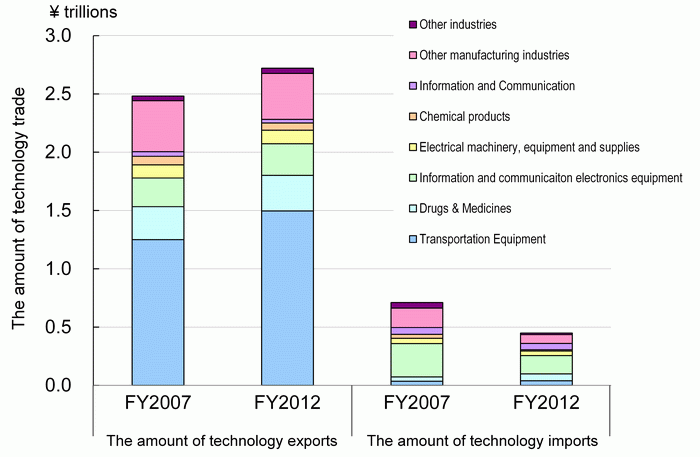
- Looking at Japan's amount of technology exports by industry classification, “transportation equipment manufacturing” had the largest amount during FY 2012. At 1.4961 trillion yen, it accounted for half of the total of all industries.
- Looking at FY 2012, the industry having a large amount of technology imports was “information and communication electronics equipment.” The amount was 157.8 billion yen and accounted for just under 40% of all industries.
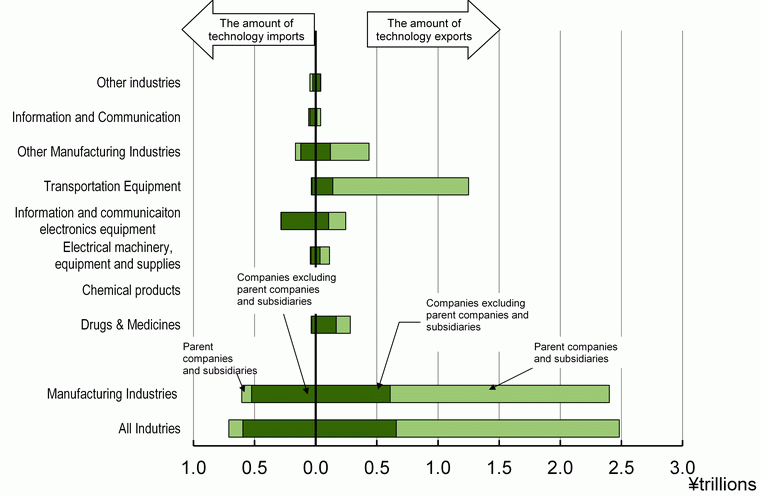
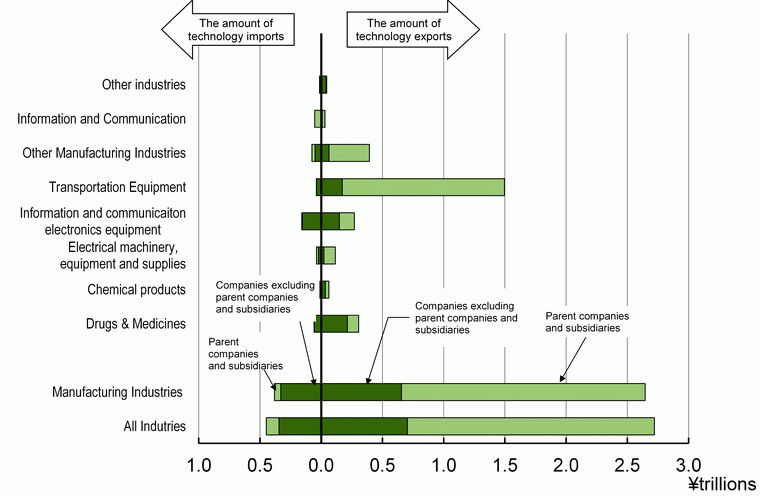
- Looking at the amount of the technology trade between parent companies and subsidiaries and that of companies excluding parent companies and subsidiaries, in the area of technology exports, trade between parent companies and subsidiaries has a higher percentage in almost all industries; however, companies excluding parent companies and subsidiaries account for more than half of trade in “drugs and medicines.” As for technology imports, companies excluding parent companies and subsidiaries have a higher percentage in almost every industry, and there is little change in this trend.
- Looking at partners for technology exports from Japan, the U.S. accounted for the largest amount, and its share has grown compared to 2006. On the other hand, while the U.S.'s share as a partner is also large in the case of technology imports, this share has fallen compared to 2007.
(1) Technology trade by industry classification
Looking at the technology trade of Japan by industry classification (Chart 5-1-4 (A)), the industry having the largest amount of technology exports in the FY 2012 was “transportation equipment manufacturing.” The amount was approximately 1.4961 trillion yen and accounted for half of the total for all industries. It was followed by “drugs and medicines” (approximately 305.7 billion yen) and “information and communication electronics equipment” (approximately 270.7 billion yen).
A comparison with FY 2007 shows that “transportation equipment manufacturing,” the industry having the largest share, increased; however, “drugs and medicines” and “information and communication electronics equipment” also showed increases.
On the other hand, the industry having a large amount of technology imports in FY 2012 was “information and communication electronics equipment.” The amount was 157.8 billion yen and accounted for just under 40% of all industries. It was followed by “drugs and medicines” 59.0 billion yen) and “information and communication electronics equipment” (53.6 billion yen).
A comparison with FY 2007 shows that the amount of technology imports in “information and communication electronics equipment” has decreased substantially. Although “drugs and medicines” increased, “information and electronics equipment” fell slightly.
Next is a look by industry classification at the amount of technology trade of parent companies and subsidiaries and that of companies excluding parent companies and subsidiaries (Chart 5-1-4 (B and, C)). It is thought that technology trade excluding parent companies and subsidiaries, in particular, is an indicator of international technical competitiveness.
In terms of technology exports, the share of parent companies and subsidiaries was larger in almost every industry. Companies excluding parent companies and subsidiaries accounted for more than half of trade in “drugs and medicines,” and their share has grown larger compared to FY 2007. The same is true for “information and communication electronics equipment.” It should be noted that in the case of “transportation equipment manufacturing,” which accounts for a large amount of technology exports, companies excluding parent companies and subsidiaries had a small share of trade.
As for technology imports, the percentage of imports that were not among parent companies and subsidiaries was higher in almost every industry.
(A) The amount of technology trade
Note:
1) For the names of the components, the names of the components in the latest Survey of Research and Development are used.
2) For the industry classification for the FY 2006, the industry classification of the Survey of Research and Development based on Japan Standard Industry Classification revised edition 2002 (the 11th) is used.
3) For the industry classification for the FY 2011, used the industry classification of the Survey of Research and Development based on Japan Standard Industry Classification revised edition 2007 (the 12th) is used.
4) The targets for technology trade are patent, know-how and technical guidance.
5) Parent companies and subsidiaries are defined that their controlling share is over 50%.
Source:
Ministry of Internal Affairs and Communications, “Report on the Survey of Research and Development”
(2) Technology trade by industry classification and partner
In this section, technology trade statistics are used to examine Japan in terms of its partners in order to elucidate technology relations between Japan and the other countries.
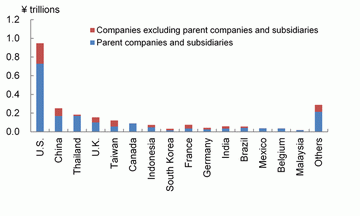
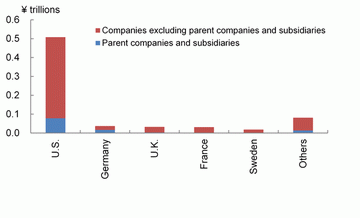
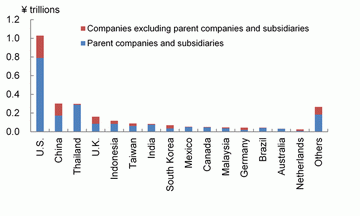
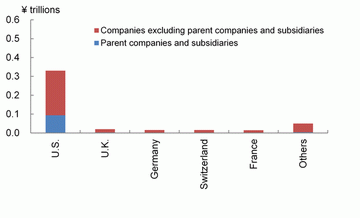
Chart 5-1-5 shows how much technology trade Japan engages in with selected countries and whether the trading enterprises are parent companies and subsidiaries.
Chart 5-1-5 (A) shows Japan's technology exports; specifically, the amounts it received as payment by partner country. The U.S. accounts for an overwhelmingly large amount, while the Asian countries of China and Thailand have large amounts among the remaining countries. The Western countries of the U.K. and Canada also have a strong presence. Compared to 2007, the U.S.'s amount increased, as did technology exports to Asia countries--notably China and Thailand. In all of the countries, technology exports among parent companies and subsidiaries are large; however, in the case of China and the U.K., technology exports by companies excluding parent companies and subsidiaries are also large.
Chart 5-1-5 (B) shows Japan's technology imports and amounts paid as payment by partner country. The U.S. also accounts for the largest amount of technology imports; the European countries have large amounts among the other countries. Compared to 2007, technology imports from the U.S. have decreased considerably, and imports from the European nations have decreased as well.
With regard to the U.S., while the technical imports of companies excluding parent companies and subsidiaries are decreasing significantly, technology imports among parent companies and subsidiaries are increasing slightly.
(a) FY 2007

(a) FY 2007

Note:
Same as the Chart 5-1-4
Source:
Ministry of Internal Affairs and Communications, “Report on the Survey of Research and Development.”
(1) Including rights related to the technologies of intellectual property rights, engineering drawings, blueprints and so-called know-how as provided for by the laws of patent rights, utility model rights, trademark rights, design rights and copy rights.
(2) Since 2002, the Ministry of Internal Affairs and Communications' “Report on the Survey of Research and Development” has surveyed data on Japan's technology trade by dividing it into the amount of the technology trade of parent companies and subsidiaries and that for companies excluding parent companies and subsidiaries.


