Here, regarding the following 7 items representing the situation of the output of scientific technology activities, the distributions or the changes in the values for the prefecture of Japan indicated are given.
1. The number of graduate students in national, public and private Universities and Colleges
2. The number of papers (all fields)
3. The number of papers (the field of Life sciences)
4. The number of papers (in fields other than Life sciences)
5. The balance of papers between the field of Life sciences and fields other than Life sciences
6. The number of patent applications
7. The number of inventors
In making these charts, the methods of grouping by the prefecture were standardized as far as possible.
1. The number of graduate students in national, public and private universities and colleges
Key Points
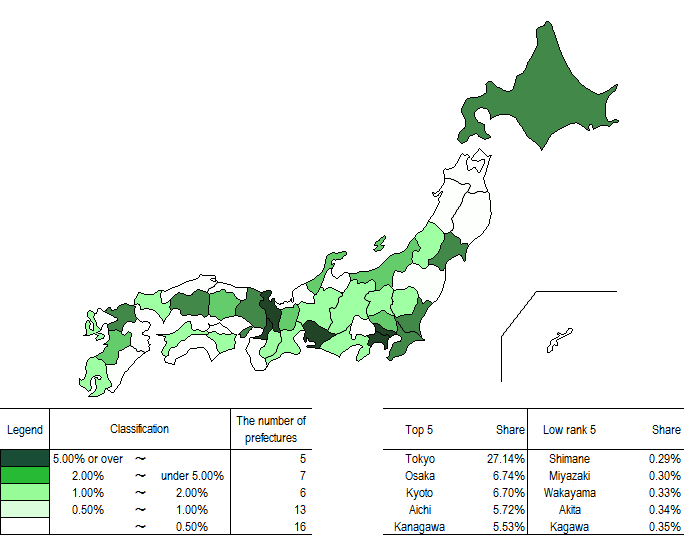
- Prefectures with large cities have more graduate students. Tokyo Prefecture has far more than any other prefecture (Chart 1-1).
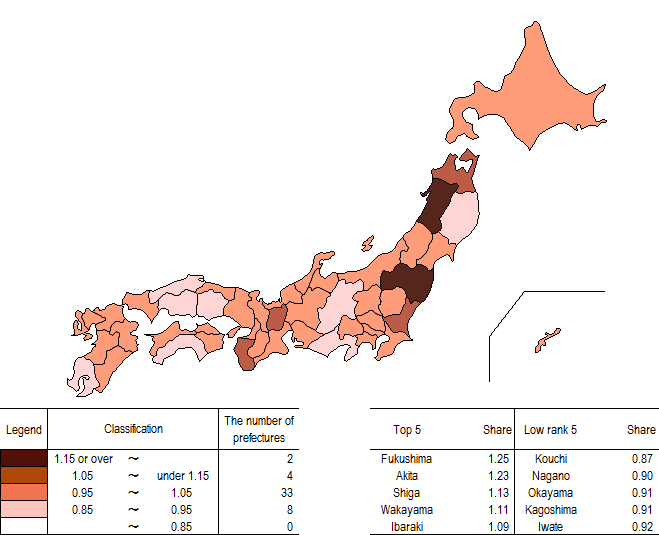
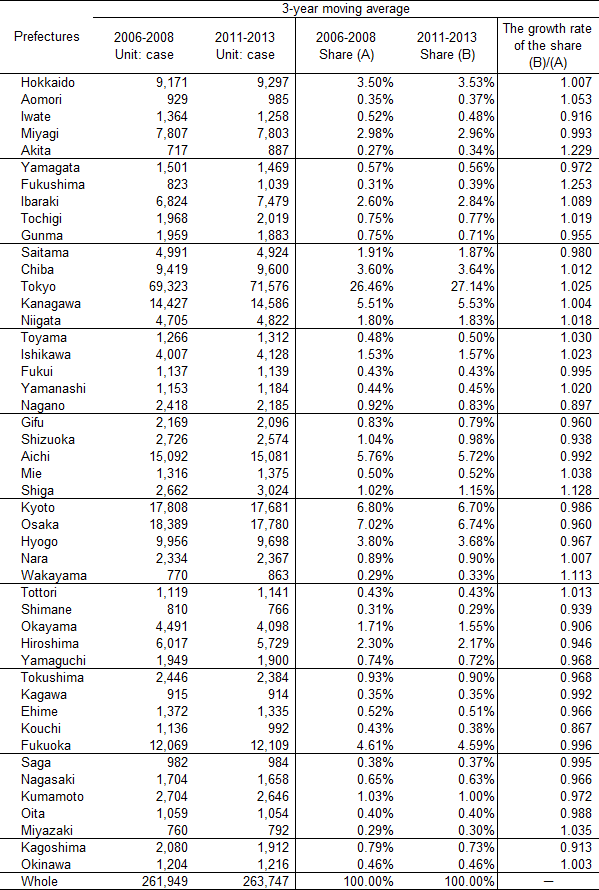
- Looking at the rate at which shares increased from 2006-2008 to 2011-2013, Fukushima Prefecture had the highest rate at 1.25, followed by Akita Prefecture at 1.23. On the other hand, there were 8 prefectures whose shares decreased with share increase rates of below 0.95 (Chart 1-2).
The average value for 2011–2013
Source:
MEXT, “School Basic Survey”
Source:
MEXT, “School Basic Survey”
Note:
“The number of graduate students” is the total of national, public and private universities and colleges. Based on the locations of the graduate courses in which students enroll.
Source:
MEXT, “School Basic Survey”
2. The number of papers (all fields)
Key Points
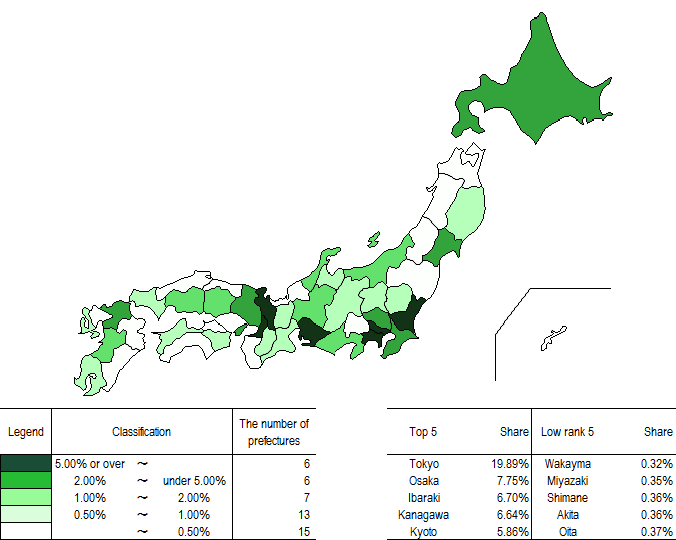
- Looking at the distribution of shares of the number of papers, they were higher in prefectures with large metropolitan areas. The top five prefectures accounted for approximately 50% of the total (Chart 2-1).
- The five prefectures with the highest shares of the number of papers were not included among the top five prefectures in terms of share increase rate. On the other hand, there were 11 prefectures whose shares decreased because their share increase rate was less than 0.95 (Chart 2-2).
Source:
Compiled by NISTEP based on Thomson Reuters, ” Web of Science (SCIE, CPCI: Science)”
Comparisons of the average values between 2005-2007 and 2010-2012
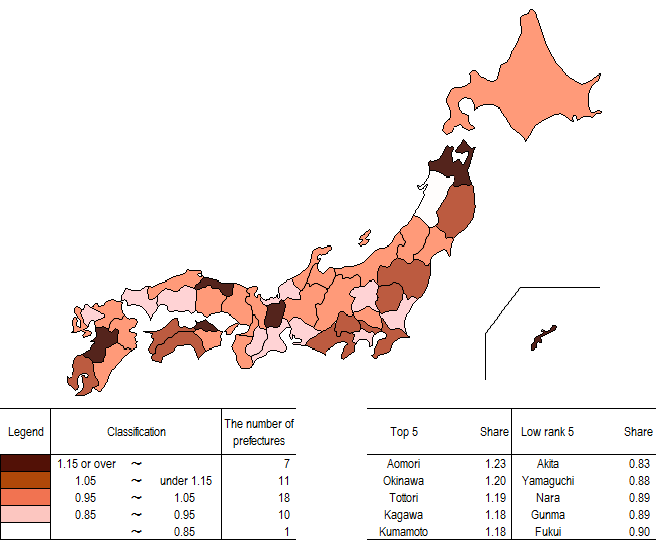
Source:
Compiled by NISTEP based on Thomson Reuters, "Web of Science (SCIE, CPCI: Science)”
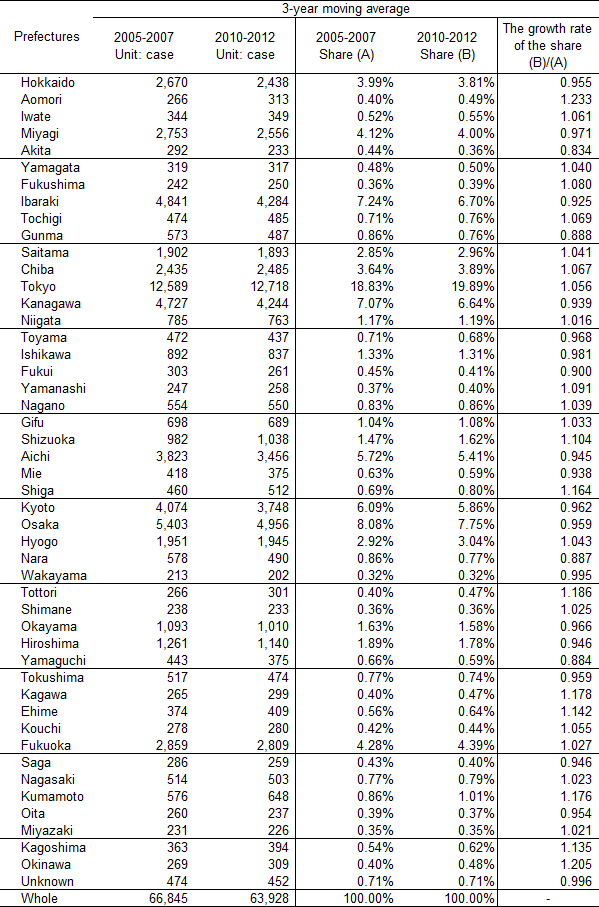
Note:
1) The papers of the prefectures were analyzed by fractional counts based on the prefectures of those institutions (faculties, research courses, etc.) to which the authors belong. For example, if a paper was written collectively by authors affiliated with the University of Tokyo (Komaba, Tokyo), University of Tokyo (Kashiwa, Chiba Prefecture), Keio University (Tokyo), Chiba University (Chiba Prefecture), and Stanford University (the U.S.), the result of the count becomes two-fifths for Tokyo and two-fifths for Chiba Prefecture.
2) Since there are some magazines that can not be classified, the total of Chart 3 and Chart 4 is not added up to the entire figures (Chart 2).
Source:
Compiled by NISTEP based on Thomson Reuters, "Web of Science (SCIE, CPCI: Science)
3. The number of papers (the field of Life sciences)
Key Points
- Data for Life sciences are shown here after papers were divided into the fields of Life sciences and the fields other than life sciences. The fields of life sciences are clinical medicine, psychiatric psychology, agricultural science, biology/biochemistry, immunology, microbiology, molecular biology/genetics, neural science/behavioral science, pharmacology/toxicology, and botany/zoology (1)
- As for the distribution of shares of the number of papers in life sciences fields only (Chart 3-1), many of these prefectures (17) had shares of 0.5%-1.0%. Only three, however, had shares of 5% or more.
- Two prefectures had a share increase rate for the number of papers of at least 1.15%. On the other hand, there were 16 prefectures whose shares decreased because their share increase rate was less than 0.95 (Chart 3-2).
The average value for 2010-2012
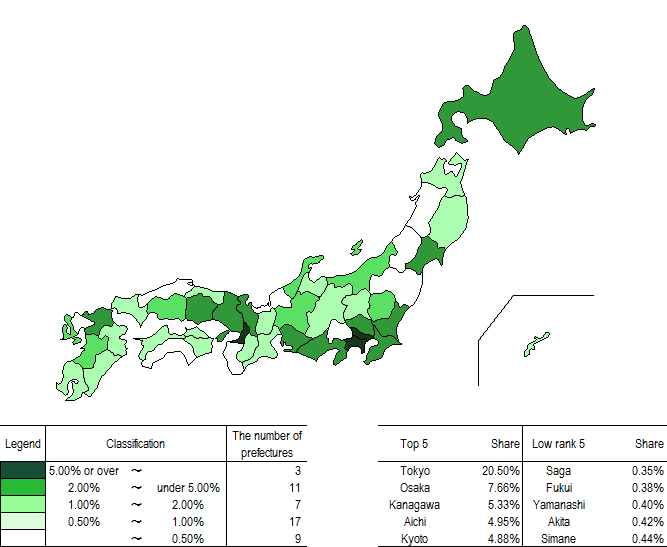
Source:
Compiled by NISTEP based on Thomson Reuters, "Web of Science (SCIE, CPCI: Science)”
Comparison of average values between 2005-2007 and 2010-2012
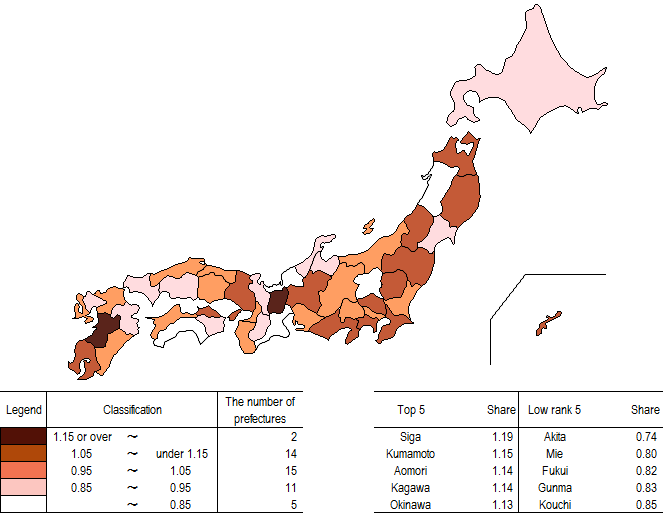
Source:
Compiled by NISTEP based on Thomson Reuters, "Web of Science (SCIE, CPCI: Science)”
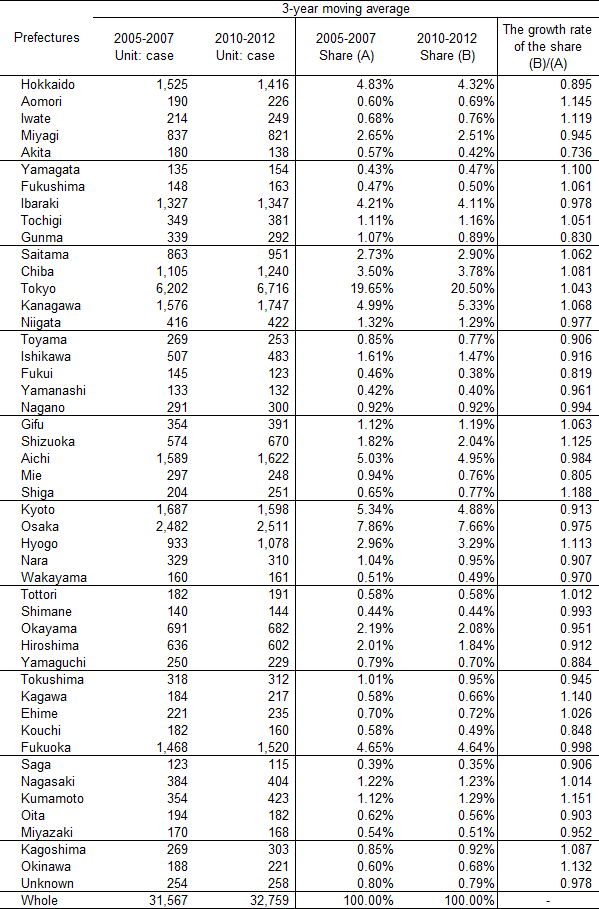
Note:
The method of counting the papers is in accordance with the note for Table 2.
Source:
Compiled by NISTEP based on Thomson Reuters, "Web of Science (SCIE, CPCI: Science)”
4. The number of papers (fields other than Life sciences)
Key Points
- The fields other than life sciences are chemistry, material science, physics, space science, computer science, mathematics, engineering, environment/ecology and geoscience. (2)
- Regarding shares of the number of papers in fields other than life sciences, seven prefectures had shares of at least 5%. However, many prefectures (20) had shares of 0.5% or less (Chart 4-1).
- Looking at the share increase rate, a relatively large number of prefectures (9) had a rate of at least 1.15. On the other hand, there were 14 prefectures whose shares decreased because their share increase rate was less than 0.95% (Chart 4-2).
The average value for 2010-2012
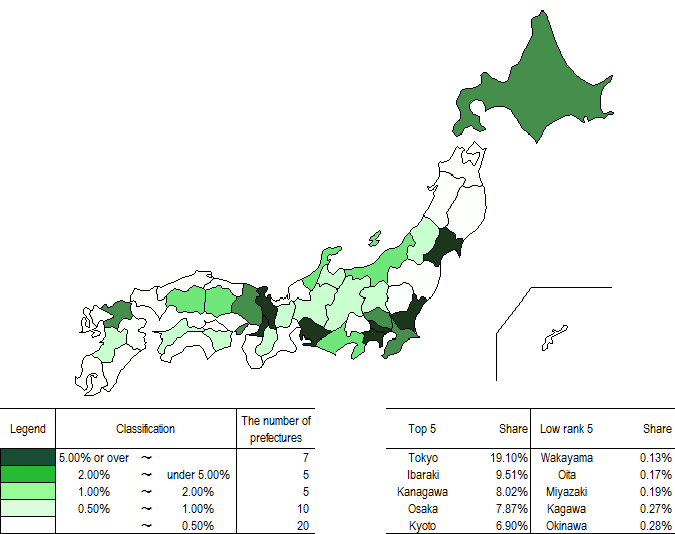
Source:
Compiled by NISTEP based on Thomson Reuters, "Web of Science (SCIE, CPCI: Science)”
Comparison of the average values between 2005-2007 and 2010-2012
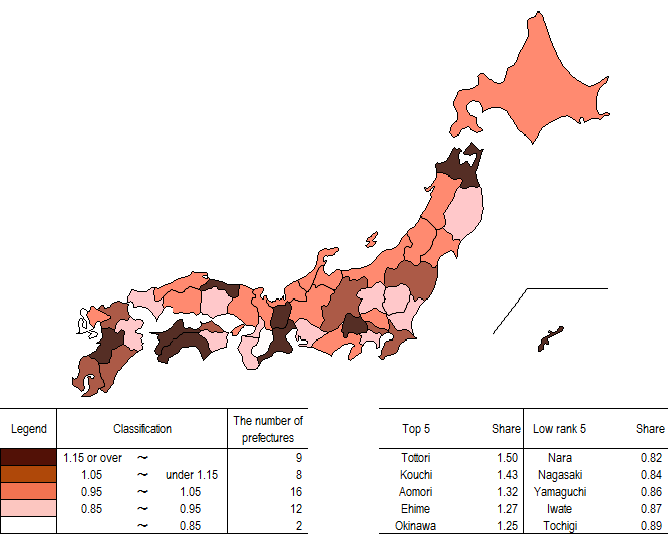
Source:
Compiled by NISTEP based on Thomson Reuters, "Web of Science (SCIE, CPCI: Science)”
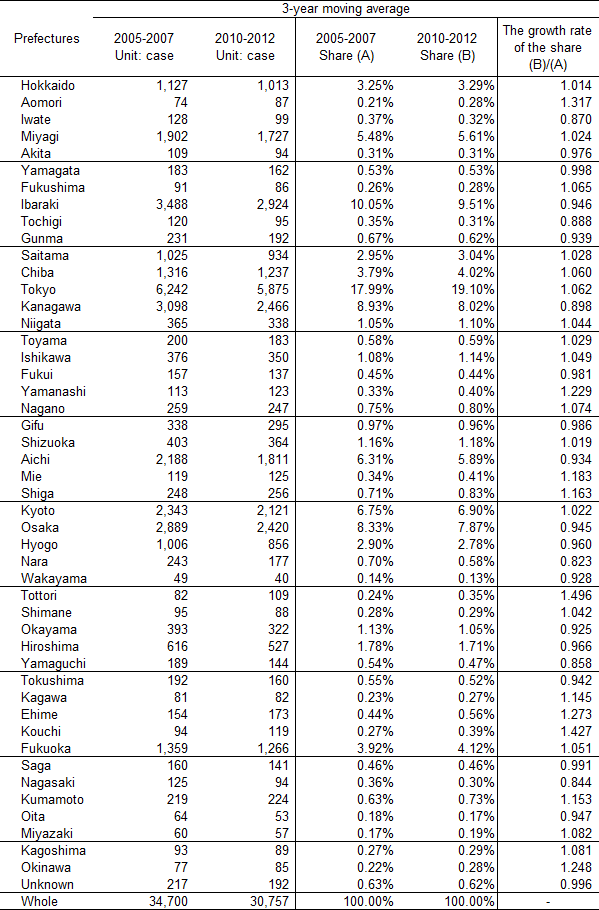
Note:
The ways of the count of the papers is followed by Note of Table 2.
Source:
Compiled by NISTEP based on Thomson Reuters, "Web of Science (SCIE, CPCI: Science)"
5. The balance of papers between Life sciences fields and fields other than Life sciences
Key Points
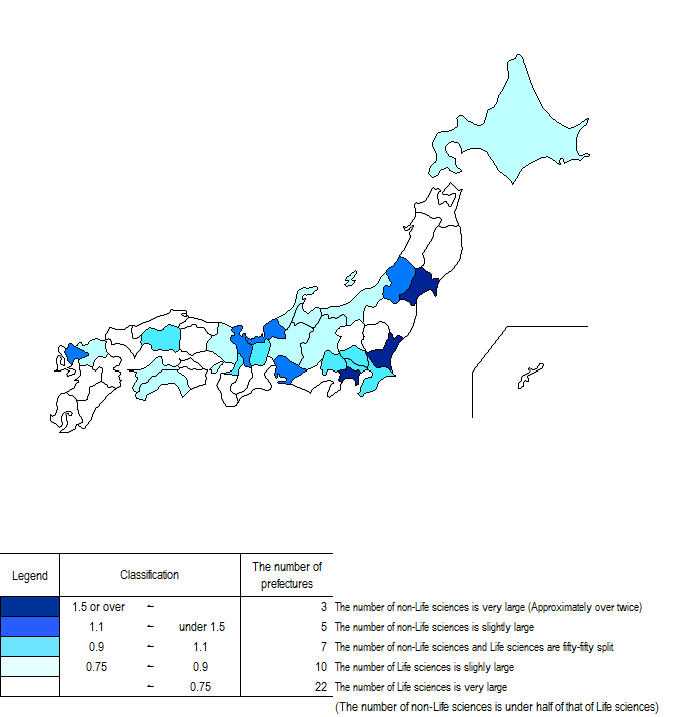
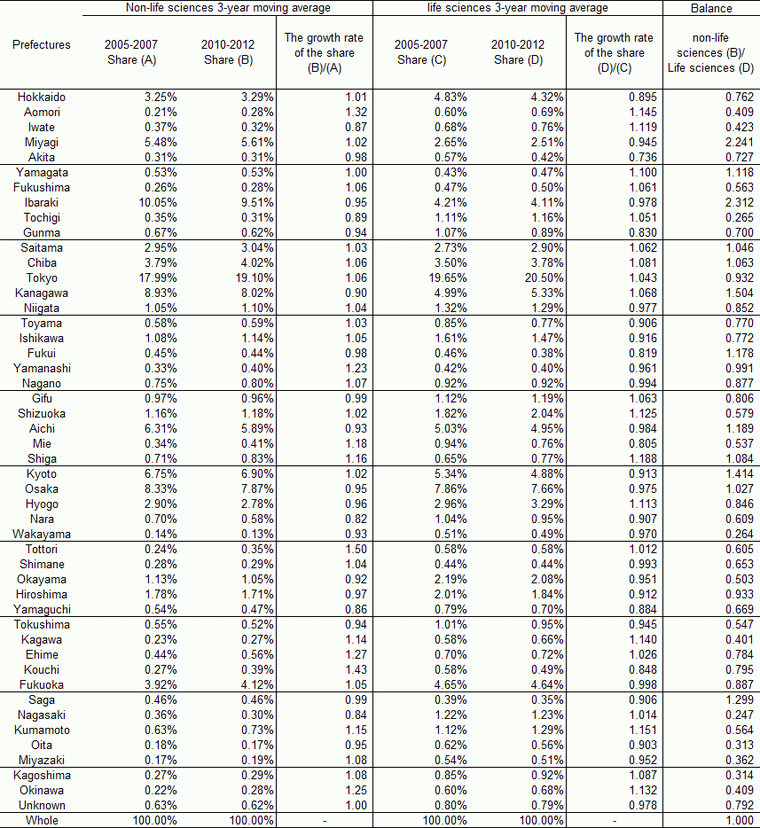
- The balance of share of papers between fields other than life sciences and life sciences fields is shown for each prefecture. To calculate the balance, the share of papers in fields other than life sciences during 2010-2012 was divided by the share of papers in the field of life sciences.
- Overall, there were many prefectures whose shares of papers in Life sciences fields were larger than those for fields other than Life sciences. Three prefectures had very large shares (1.5 or more) of the number of non-Life science papers, and 22 prefectures had very large shares (0.75 or less) of the number of Life science papers (Chart 5).
(non-life sciences/life sciences)
Source:
The balance of papers between life sciences fields and fields other than life sciences (non-life sciences/life sciences)
Note:
The method of counting the papers was in accordance with the note to Table 2. The values of the 3-year moving averages for fields other than Life sciences and for Life sciences fields were the same as in Table 3 and Table 4.
Source:
Compiled by NISTEP based on Thomson Reuters, "Web of Science (SCIE, CPCI: Science)”
6. The number of patent applications
Key Points
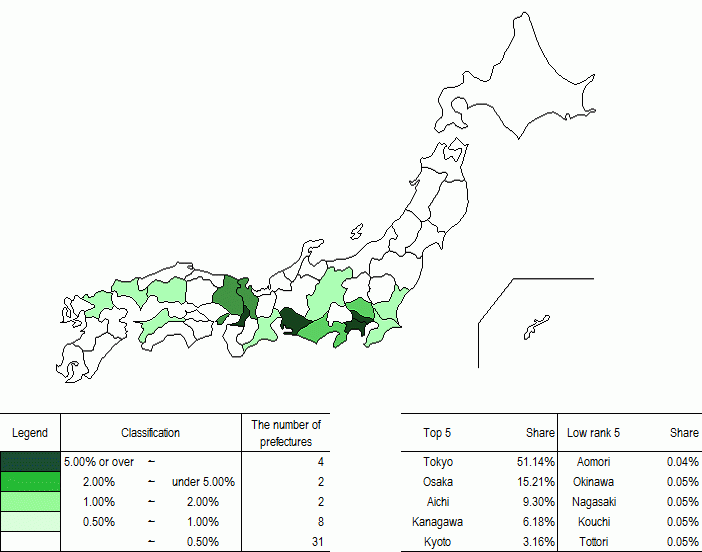
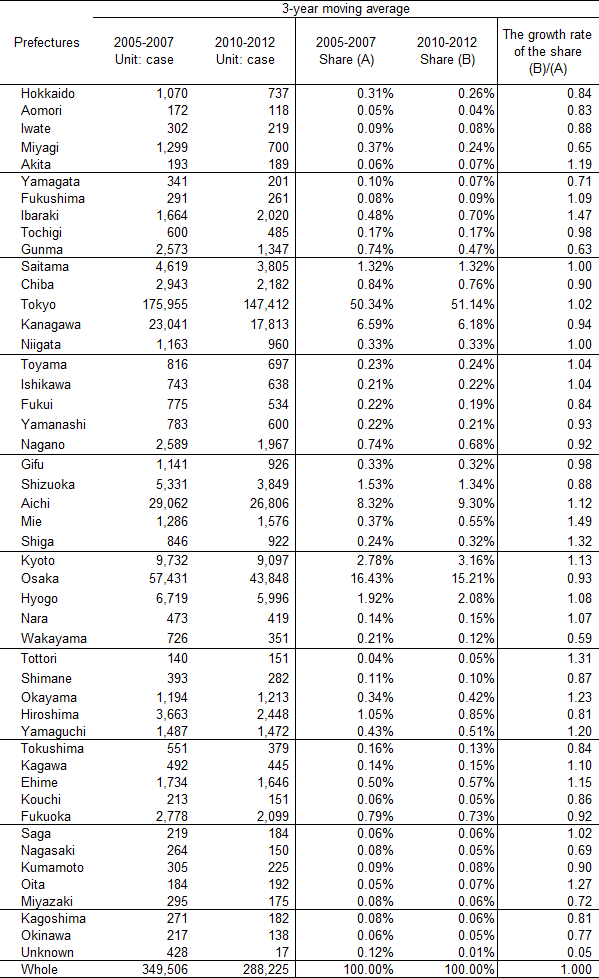
- Looking at the distributions of the share of the number of patent applications for 2010-2012, Tokyo accounted for 51.14% of the total, followed by Osaka with 15.21%. Moreover, the top 5 prefectures alone account for about over 80% (Chart 6-1). This is because the headquarters of many business enterprises are concentrated in Tokyo and there are many cases that the addresses of the headquarters are written down when patents are applied for.
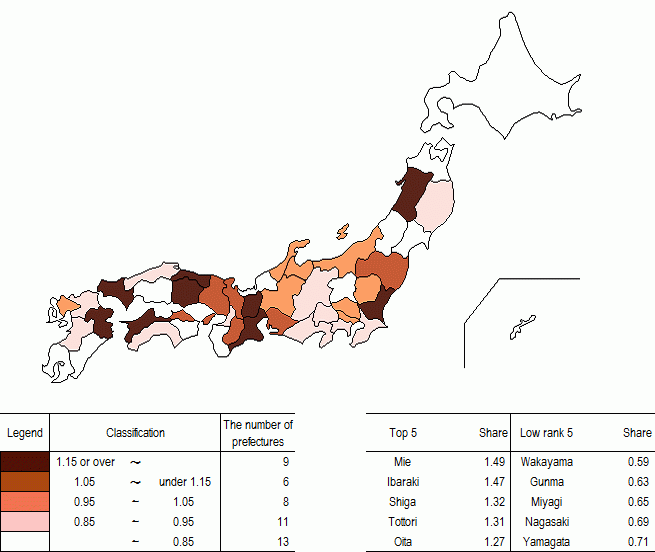
- Looking at the share increase rate from 2005-2007 to 2010-2012, prefectures showing growth included Mie and Ibaraki Prefectures. However, looking at the whole, half of the prefectures (24) had shares that are decreasing because their share increase rate was less than 0.95 (Chart 6-2).
The average value for 2010-2012
Source:
Japan patent Office, “Japan Patent Office Annual Report”
Comparison of the average values between 2005-2007 and 2010-2012
Source:
Japan Patent Office, “Japan Patent Office Annual Report”
Note:
1) By Japanese people.
2) The column for others indicates that the prefecture cannot be determined.
3) The address of the first listed applicant is counted
Source:
Japan Patent Office, “Japan Patent Office Annual Report”
7. The number of inventors
Key Points
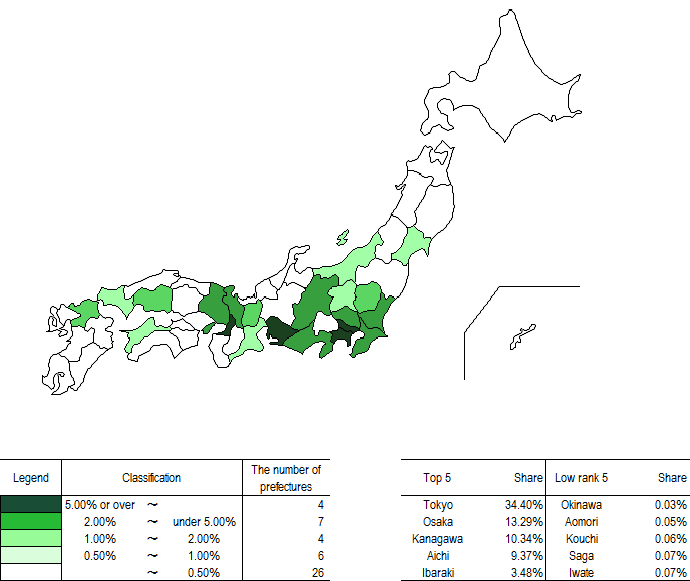
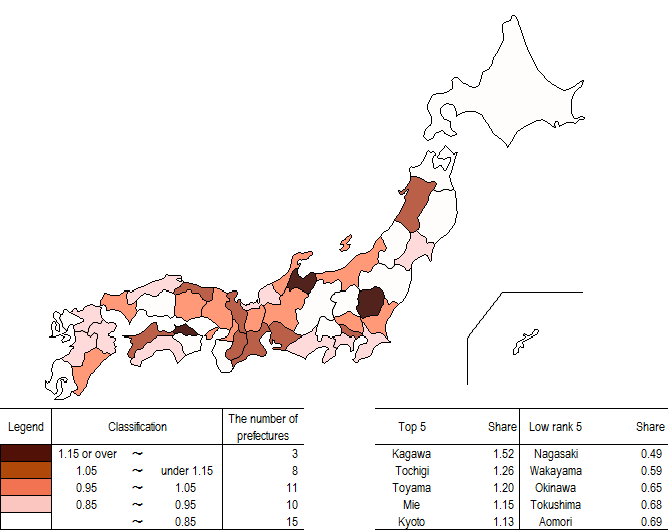
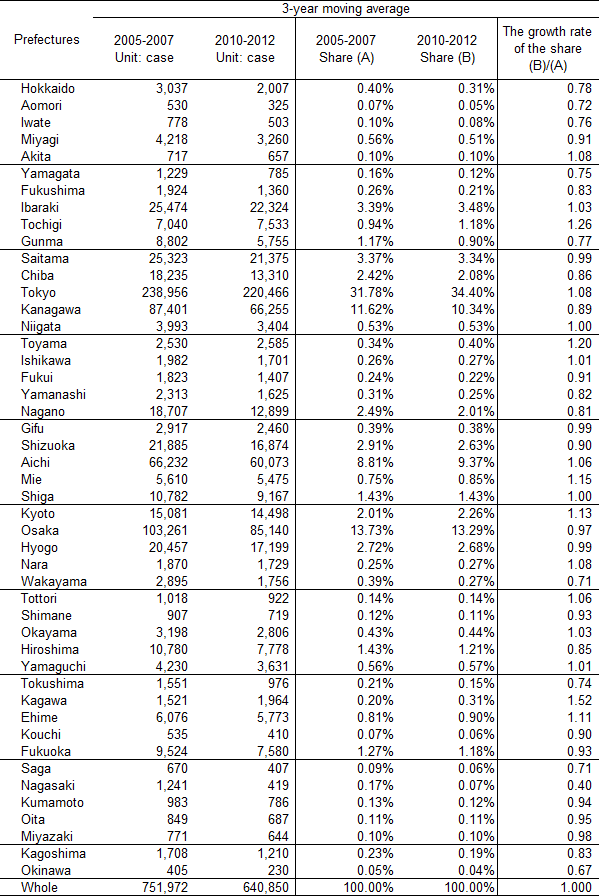
- Comparison of the status of patent applications, which are a result of intellectual production activities, with the distribution of shares of the number of applications (Chart 6-1) and the distribution of shares of actual inventors (Chart 7-1) found that many prefectures with large shares of inventors are among the prefectures with the largest shares of patent applications and they are also widely distributed in neighboring regions.
- Three prefectures had a high share increase rate for the number of inventors of at least 1.15. On the other hand, there were 25 prefectures whose shares decreased because their share increase rate was less than 0.95 (Chart 7-2).
The average value for 2010-2012
Source:
Japan Patent Office, “Japan Patent Office Annual Report”
Comparison of average values between 2005-2007 and 2010-2012
Source:
Japan Patent Office, “Japan Patent Office Annual Report”
Note:
1) The number of people is the total numbers of people who are abstracted from “Applicants” who were written on one application.
2) Excluding international applications (PCT applications)
Source:
Japan Patent Office, “Japan Patent Office Annual Report”
(1) Refer to Chart 4-1-4 (B) in Chapter 4 of the main text.
(2) Refer to Chart 4-1-4 (B) in Chapter 4 of the main text.


