5.4 The relationship between R&D and innovation
Key points
- Japan's share of companies that achieved product innovation is low compared to the selected countries and decreasing. However, the shares of Germany, the U.K., and Korea are also decreasing.
- On the other hand, looking at shares of companies that achieved process innovation, while Japan's share is low compared to the selected countries, it is the only country among them that has a growing share.
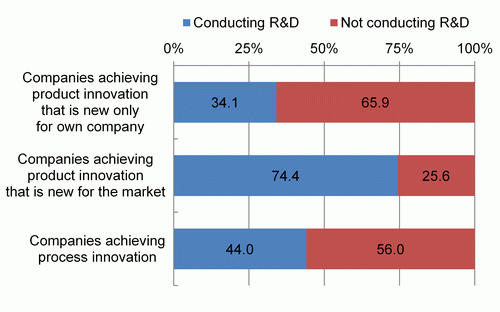
- Companies that achieved product innovation with higher novelty have a larger share of companies that conduct R&D.
(1) International comparison of shares of companies that achieved process innovation
The National Institute of Science and Technology Policy carried out the “Third Japanese National Innovation Survey” and then compiled survey results intended to shed light on the actual circumstances and trends of innovation activities by Japanese companies having at least 10 full-time employees.(5) This section will present the actual circumstances of innovation activities in Japan.
The Japanese National Innovation Survey is a set of government statistics that is approved by the Ministry of Internal Affairs and Communications. The first innovation survey ever conducted in Japan, it was launched by the National Institute of Science and Technology Policy (reorganized in July 2013 under the same English name) in January 2003 as a collection of statistical reports. Subsequently, the second survey was conducted in July 2009 and the third in January 2013 as a set of general statistics. All of the surveys were based on the “Oslo Manual.” (6) Moreover, given that international comparisons by the OECD and other organizations are based on the Community Innovation Surveys (CIS) (7) of EU member countries, etc., the survey sheets and method for the first and third surveys were also based on the CIS in order to improve the international comparability of survey results(8). Accordingly, when making time-series comparisons, this section compares the first survey (survey period of 1999 to 2001) and the third survey (survey period of 2009 to 2011).」
Premised on “introduction of new items/methods for own company” and “acceptability if new for own company, even if not necessarily new for other companies” as a definition of “innovation” based on the Oslo Manual, the third survey looked at four types of innovation (Chart 5-4-1). The first two surveys examined the achievement of (i) product innovation and (ii) process innovation, while the third survey also examined the achievement of (iii) organizational innovation and (iv) marketing innovation.

Source:
National Institute of Science and Technology Policy, “A report on the Japanese National Innovation Survey 2012 2012”
Chart 5-4-2 shows the shares of companies that achieved innovation in the surveys of selected countries.
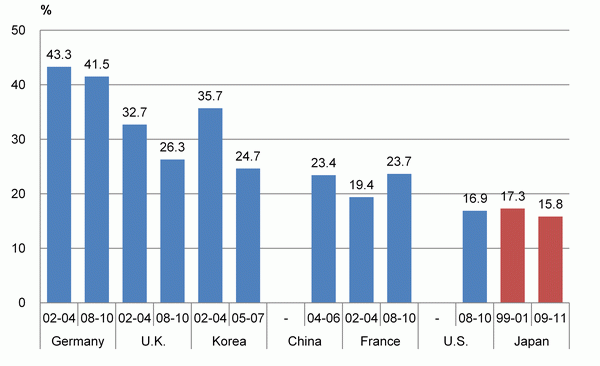
First, looking at the shares of companies that achieved product innovation for the latest survey period of each country, Japan had the lowest share with 15.8%. The country with the largest figure was Germany with 41.5%. Additionally, a comparison with earlier survey periods shows that, with the exception of France, all countries are showing downward trends. The country with the largest decrease is Korea (Chart 5-4-2 (A)).
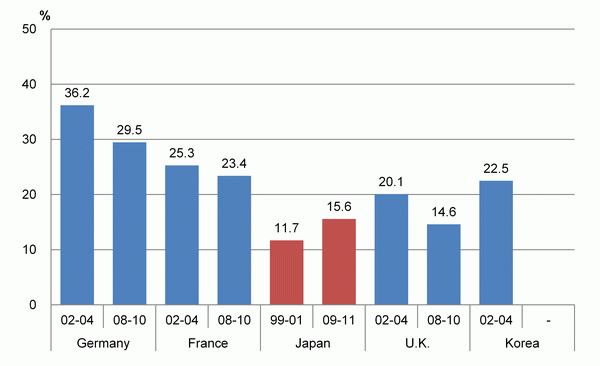
Next, looking at the shares of companies that achieved process innovation in the latest results of each country, Japan had a share of 15.6%, which was lower than Germany and France but higher than the U.K. A comparison with previous survey periods shows that only Japan posted an increase, while all of the other countries saw declines (Chart 5-4-2 (B)).
(A) Shares of companies that achieved product innovation
(B) Shares of companies that achieved process innovation
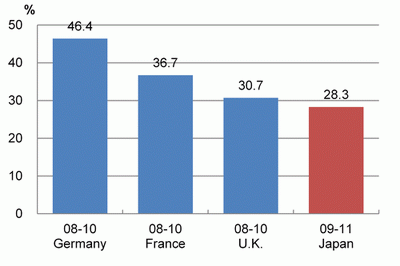
Next, looking at the shares of companies that achieved organizational innovation, Japan had a share of 28.3%, which was low compared to the other countries. The country with the largest figure was Germany with 46.4%.
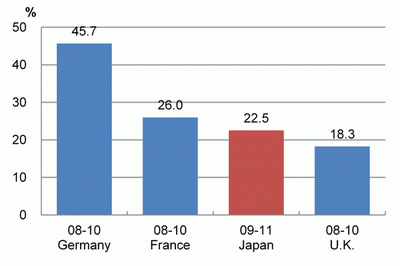
Looking at the shares of companies that achieved marketing innovation, Japan had a share of 22.5%, which was lower than Germany and France but higher than the U.K.
While it is true that Japan's share of companies that achieved process innovation is low compared to the selected countries, Japan's shares of companies that achieved process and marketing innovation surpassed those of the U.K. Moreover, looking at process innovation, Japan is the only country among the countries that has a growing share in comparison with previous surveys.
(D) Shares of companies that achieved marketing innovation
Notes:
1) “Fiscal year” is used for Japan; “year” is used for other countries.
2) Only the latest data are provided for China and the U.S.
3) Figures are estimates of share among all companies of the survey population. The figures for Japan are estimates of all industries (core) that include only core industries of CIS 2010, thereby matching them to other countries and similar standards for the purpose of international comparison. The figures for Korea are for manufacturing industries, and product innovation refers to manufactured goods only.
Sources:
1) National Institute of Science and Technology Policy, ” A report on the Japanese National Innovation Survey 2012”
2) 2002-2004 figures for Germany, France, the U.K., and Korea and 1999-2001 figures for Japan are quoted from OECD, “Innovation in Firms.”
3) Figures for the U.S., China, and Korea are quoted from OECD Science, Technology, and Industry Scoreboard 2013. It should be noted that figures for the U.S. are the results of the 2010 Business R&D and Innovation Survey (BRDIS; survey years 2008-2010); figures for China are results of the Industrial Enterprises Innovation Survey (survey years: 2004-2006); and figures for Korea are results of the 2008 Korean Innovation Survey (survey years: 2005-2007).
4) Figures for the U.K., France, and Germany are quoted from results of CIS 2010 (survey years: 2008 to 2010) that are recorded in the Eurostat database.
(2) R&D by companies that achieved innovation in Japan
Chart 5-4-3 looks at the implementation of R&D, with focus on companies that achieved product/process innovation, which are areas of innovation thought to have a strong connection with R&D.
Looking at the implementation of R&D by classifying product innovation into “new for own company only” (although not new for the market) and “new for the market” (meaning that the innovation is naturally new for the company, too), 34.1% of “companies that achieved product innovation that is new only for own company” conducted R&D, while 74.4% of companies achieving product innovation that was “new for the market,” which has higher novelty, conducted R&D.
Additionally, 44.0% of companies that achieved process innovation conducted R&D.
Note:
The survey period was 2009-2011.
Source:
National Institute of Science and Technology Policy, ” A report on the Japanese National Innovation Survey 2012”
The shares of companies that achieved innovation that are presented here are the results of aggregation based on numbers of companies without consideration for company size. Therefore, the circumstances of small and medium-size enterprises, which make up the majority of the number of companies, are more strongly expressed in the data. Although aggregation that considers differences in the distribution of company numbers by size in each country or aggregation that is directly weighted by company size can be considered as alternative perspectives here. However, future study is desired so that such aggregation can be handled in an internationally consistent manner.
(5) NISTEP, NISTEP Report No. 156 “A Report on the Japanese National Innovation Survey 2012” (March 2014).
(6) The Oslo Manual is a set of guidelines for collecting and interpreting innovation data. The third edition (the latest edition) was jointly prepared by the OECD and Eurostat.
(7) Countries that have entered the European Economic Area (EEA) Agreement, which includes EU members, must provide certain indicators on innovation that are based on survey implementation to the European Commission in accordance with European Commission Regulation No. 1450/2004. These European countries have implemented CISs regularly since 1994. The CISs are also based on the Oslo Manual. The surveys are executed with a uniform survey sheet (CIS harmonized survey questionnaire) and survey method (CIS Methodological Recommendation). It should be noted that CIS items are referenced when the OECD and other organizations collect data from countries for international comparison.
(8)The second survey emphasized necessity in innovation research taking place within NISTEP. While it was based on the Oslo Manual, it did not conform well with the CIS.

