In recent years, there have been increasingly strong demands for accountability in R&D investments, and thus understanding the output of R&D has become a major theme. This chapter introduces changes in and features of the world's and main countries’ R&D activities, focusing attention on scientific papers and patents as measurable output of such R&D activities.
4.1 Scientific Papers
Key points
- The quantity of papers, which are the output of the world's research activities, has consistently shown an upward trend.
- Research activities themselves have changed from the activities of a single country into joint activities that are conducted by multiple countries. The number of internationally co-authored papers is increasing worldwide. In 2012 (publication year: PY), the international co-authorship rate stood at 57% for the U.K., 56% for France, and 53% for Germany. These figures are in contrast with 37% for the U.S. and 29% for Japan.
- Regarding the number of papers produced in Japan (the average from 2010-2012 [PY]), using fractional counting (degree of contribution to the production of papers), Japan ranked third behind the U.S. and China. In terms of number of adjusted top 10% papers, Japan ranked sixth behind the U.S., China, U.K., Germany, and France. And in terms of number of adjusted top 1% papers, Japan ranked 7th behind the U.S., China, U.K., Germany, France, and Canada.
- On the other hand, when based on whole counting (degree of contribution to the production of papers: fractional counting + overseas contribution through internationally co-authored papers), Japan ranked fifth in terms of number of research papers produced, eighth in number of adjusted top 10% papers, and eleventh in number of adjusted top 1% papers.
- Looking at share of the number of papers, between the 1980s and the early 2000s, Japan's share grew to surpass those of the U.K. and Germany, and for a while ranked number two in the world; however, its share has been declining in recent years. However, this tendency toward a declining share is not limited to Japan, as it is also seen for the U.K., Germany, and France.
- Looking at changes in shares of the numbers of adjusted top 10% papers and adjusted top 1% papers as qualitative indicators, Japan saw its shares increase gradually from the 1980s into to the early 2000s; however, these shares have been decreasing rapidly since then.
- Looking at the balance of the fields in Japan, the shares of chemistry and basic life sciences have decreased significantly, while that of clinical medicine has increased significantly. Thus the makeup of fields covered in Japan's paper production is changing substantially.
- Meanwhile, looking at field portfolios by world share of adjusted top 10% papers, Japan is weighted towards physics and chemistry, with low weight on computer science/mathematics, environment/geoscience, and engineering.
4.1.1 Quantitative and qualitative changes in research activities in the world
(1) The change in the numbers of papers
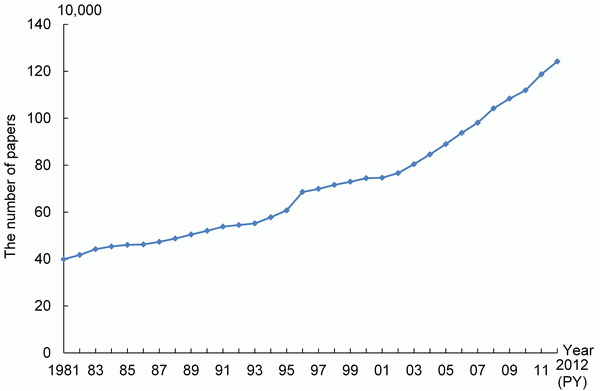
Chart 4-1-1 shows the change in the quantity of the world's papers. The method for analysis has been modified given that revisions are made to the bibliographic data on papers in the Thomson Reuters database when necessary and that significant changes have been made to database formats, etc. (see pg. 135 of the Technical Notes). Consequently, any comparisons made with the previous version “Japanese Science and Technology Indicators 2013” (August 2013) will be incoherent.
Compared with the early 1980s, the quantity of papers presented in the world has roughly tripled as research activities show a consistent quantitative expansion across the globe. For this period, journals recorded in Databases, which have been used for analysis, were revised in order of precedence, and the numbers of the journals has been enlarged. This factor is contributing to expanding the numbers of papers as well.
Note:
The analysis targeted articles and reviews. Publication year (PY) was used in annual aggregation.
Source:
Compiled by NISTEP based on Thomson Reuters, “Web of Science (SCIE, CPCI: Science)”
(2) Changes in the style of the production of papers in the world and selected countries
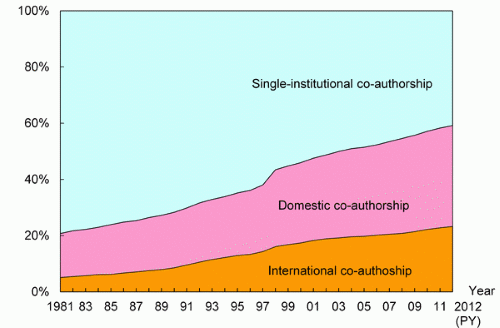
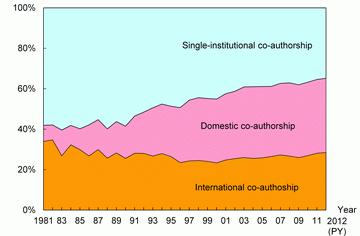
While research activities in the world have moved toward a quantitative expansion, the style of research activities has changed to a large extent. Chart 4-1-2 shows the change in form of the co-authorship of papers in main countries by the three categories: (1) Single-institutional co-authorship papers (Papers by authors who belong to a single institute), (2) Domestic co-authorship papers (Papers by authors who belong to multiple institutes located in a single country), (3) Internationally co-authored papers (Papers by authors who belong to institutes located in different countries).
This figure shows that the ratio of single-institutional co-authorship papers has declined, and that of domestic co-authorship papers and internationally co-authored papers has increased. In the 1980s, single-institutional co-authorship papers accounted for approximately 80%, however, after that, domestic co-authorship papers and internationally co-authored papers increased. It can be said that activities for knowledge production have been done by transcending the framework of institutes and countries. As of 2012, single-institutional co-authorship papers accounted for 40.8%, domestic co-authorship papers for 35.9%, and internationally co-authored papers for 23.3%.
Note:
The analysis targeted articles and reviews. Publication year (PY) was used in annual aggregation.
Source:
Compiled by NISTEP based on Thomson Reuters, “Web of Science (SCIE, CPCI: Science)”
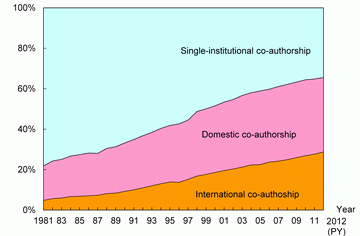
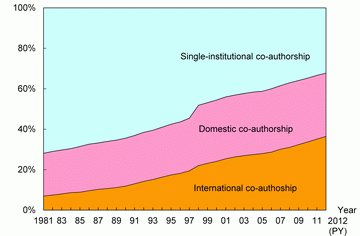
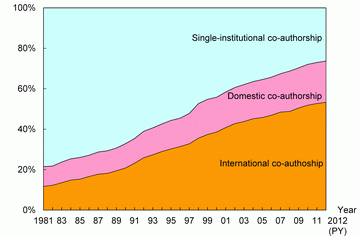
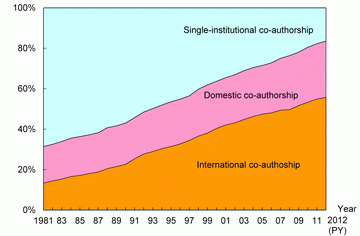
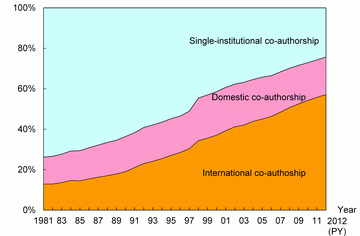
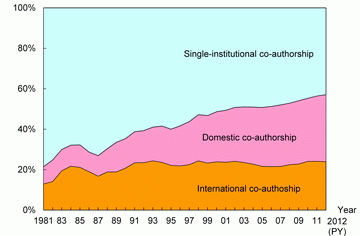
Chart 4-1-3 shows trends in the shares of co-authorship styles in the number of papers of the selected countries. All of the countries share the fact that the percentage of internationally co-authored papers is increasing. However, the size of this percentage varies from country to country. As of 2012, it was 28.8% for Japan and 36.5% for the U.S. These figures contrast with very high percentages in Europe, as is demonstrated by 53.3% for Germany, 55.8% for France, and 57.1% for the U.K.
On the other hand, a characteristic in Japan's co-authorship styles is that the percentage of domestic co-authorship papers has grown by approximately 20 percentage points compared to the 1980s. This demonstrates how strong relationships among research institutions are in Japan compared to other countries.
Note:
The analysis targeted articles and reviews; analysis is based on whole counting. Publication year (PY) was used in annual aggregation.
Source:
Compiled by NISTEP based on Thomson Reuters, “Web of Science (SCIE, CPCI: Science)”
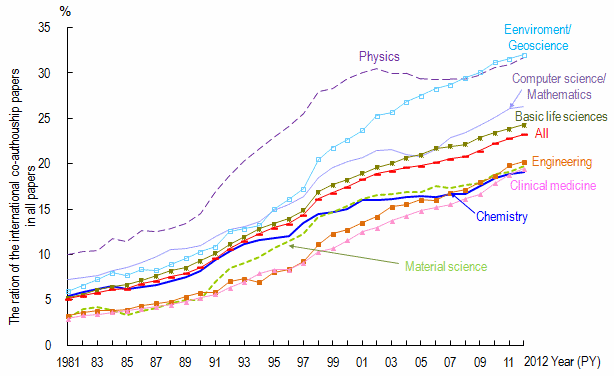
Moreover, since internationally co-authored papers are a fruit made from international research cooperation and joint activities, they depend upon the background of each field. For example, when individual countries cannot realistically possess large-scale research facilities, joint research tends to take place primarily in countries into which large-scale international research facilities have been installed.
Chart 4-1-4 shows changes in the ratios of internationally co-authored papers in each field. In all of the fields, the percentage of internationally co-authored papers has been rising since the 1980s. As of 2012, percentages of internationally co-authored papers stood at 32.0% in environment/geoscience and 31.7% in physics; these figures were high compared to the other fields. On the other hand, chemistry had the lowest percentage of internationally co-authored papers with 19.0%.
Notes:
1) The analysis targeted articles and reviews. Publication year (PY) was used in annual aggregation.
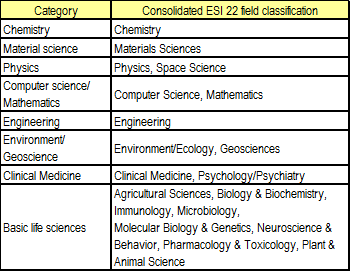
2) Used (B) for the classification fields of (A).
3) Reclassified the papers included in “Web of Science” by ESI22 classification fields and analyzed by field for the classification fields of (B).
Classification of journals is based on http://incites-help.isiknowledge.com/incitesLive/ESIGroup/overviewESI/esiJournalsList.html (refer to publication data as of April 15, 2014).
Analyzed ESI19 classification fields excluded economics/economic & business, multidisciplinary and social science general.
Source:
Compiled by NISTEP based on Thomson Reuters “Web of Science” (SCIE, CPCI: Science)
4.1.2 A comparison of research activities by country
(1) Method for quantifying scientific research capability at the country level
When quantifying and comparing “national scientific research capability,” the increasing complexity in co-authorship styles of recent years that was mentioned above should be considered.
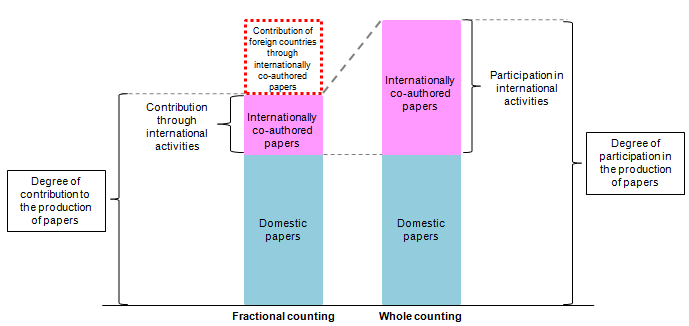
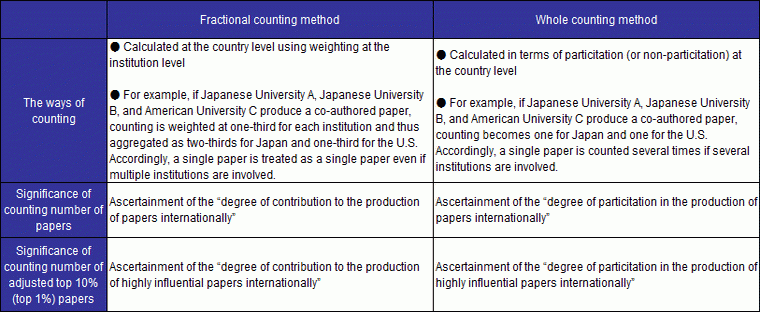
Thus, as is shown in Chart 4-1-5, this section ascertains scientific research capability at the country level in terms of “degree of contribution to the production of papers (i.e., degree of contribution to individual papers)” and “degree of participation in the production of papers (i.e., degree of involvement in the process of producing papers).” The former is measured using fractional counting and the latter using whole counting. The difference between the degree of contribution and degree of involvement in the production of papers can be described as the “contribution of foreign countries through internationally co-authored papers.” Because the circumstances of international activities differ among nations and regions, rankings can switch around depending on the counting method used.
Moreover, a quantitative standpoint and qualitative standpoint are required when examining “national scientific research capability.” Given this, number of papers is used as the quantitative standpoint and number of highly cited papers extracted from other papers (number of adjusted top 10% papers and number of adjusted top 1% papers) are used as the qualitative standpoint.
“Number of adjusted top 10% (top 1%) papers” refers to a number of papers that is obtained by extracting those papers whose number of times (values as of the end of 2012) cited enters the top 10% (1%) in each field and then adjusted so that it is 1/10 (1/100) of the number of papers in terms of real numbers. The number is calculated for each field in this way in order to standardize differences that arise from significant variations in the average number of times cited in each field. The fields are pursuant to Chart 4-1-4.
(2) Time-series comparison of number of papers, number of adjusted top 10% papers, and number of adjusted top 1% papers by country/region
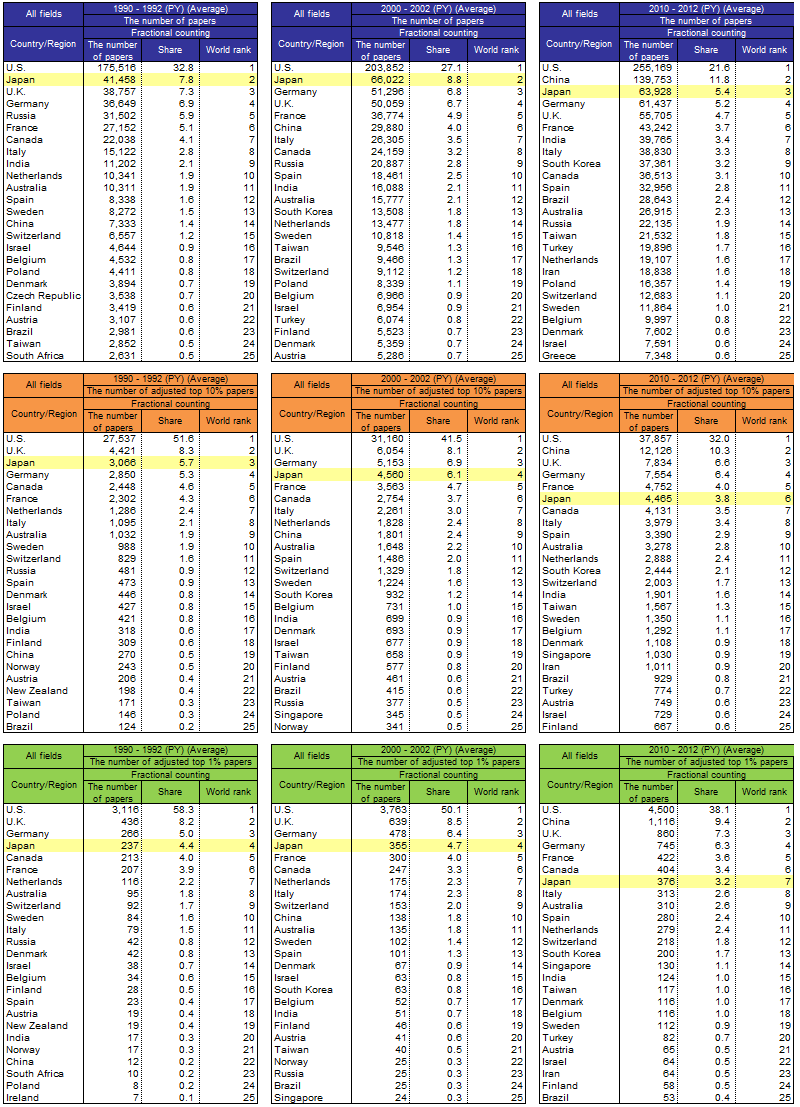
Chart 4-1-6 shows number of papers, number of adjusted top 10% papers, number of adjusted top 1% papers, and international ranking for individual countries and regions based on fractional counting and whole counting.
Japan's number of papers (average for 2010 to 2012) ranked third when based on fractional counting. Japan ranked sixth in the number of adjusted top 10% papers and seventh in the number adjusted top 1% papers.
On the other hand, when based on whole counting, Japan ranked fifth in terms of number of research papers produced, eighth in number of adjusted top 10% papers, and eleventh in number of adjusted top 1% papers.
(A) Conceptual diagram of the method for ascertaining scientific research capability at the country level
Note:
“Number of adjusted top 10% (top 1%) papers” refers to a number of papers that is obtained by extracting those papers whose number of times cited enters the top 10% (1%) in each field for each year and then adjusted so that it is 1/10 (1/100) of the number of papers in terms of real numbers. For details see the method calculation used for number of adjusted top 10% papers described in section 2-2 (7) of NISTEP “Benchmarking Scientific Research 2012” (Research Material No. 218). Fields are based on the explanatory remarks of Chart 4-1-4 (B). Numbers of times cited are values as of the end of 2013.
by country/region: Top 25 countries/regions
(A) Fractional counting
(B) Whole counting
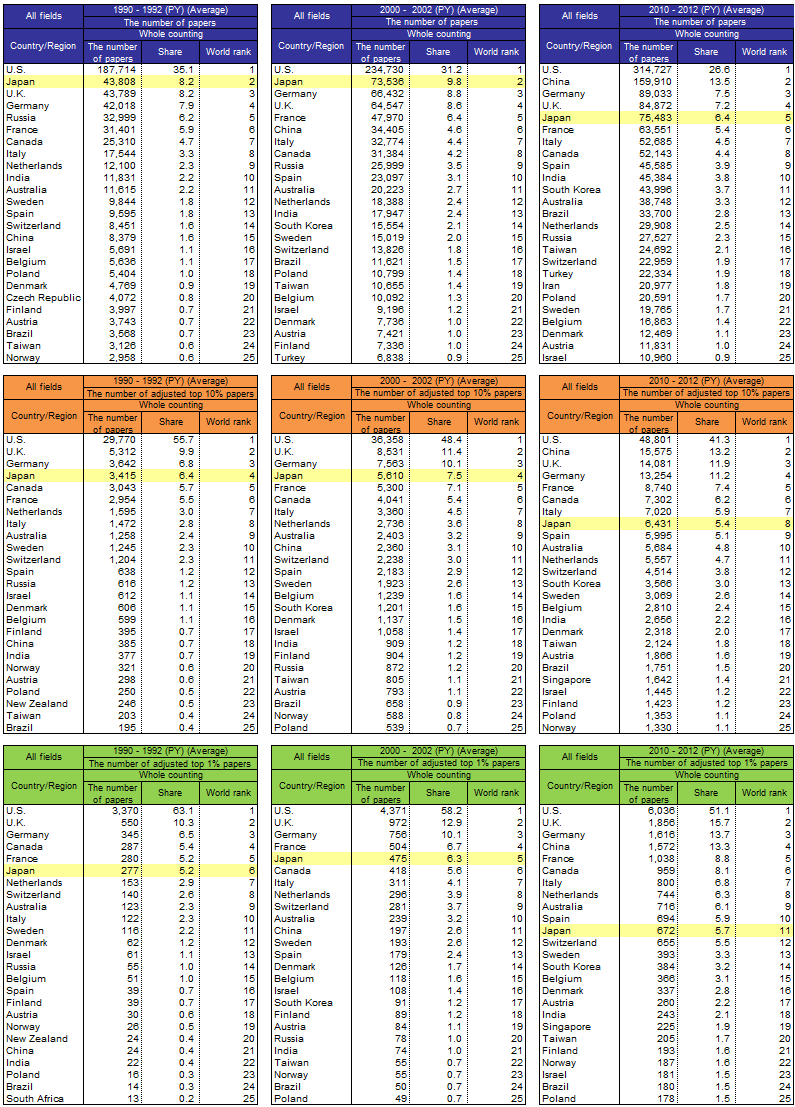
Note:
The analysis targeted articles and reviews. Publication year (PY) was used in annual aggregation. Numbers of times cited are values as of the end of 2013.
Source:
Compiled by NISTEP based on Thomson Reuters “Web of Science” (SCIE, CPCI: Science)
(3) Time-series trends in share of number of papers, share of number of adjusted top 10% papers, and share of number of adjusted top 1% papers in the selected countries
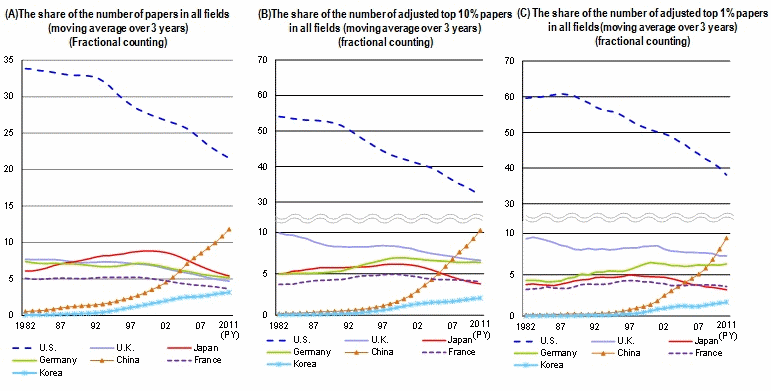
Chart 4-1-7 compares the selected countries’ shares of the number of papers using fractional counting in order to ascertain each country's research activities in quantitative terms.
Here, it is apparent that the U.S. has consistently had a much larger share than the other countries since the 1980s. However, this share has been shrinking since the 1980s as the shares of the others have been growing. Between the 1980s and the early 2000s, Japan's share grew to surpass those of the U.K. and Germany, and for a while ranked number two in the world. However, China's share has been growing rapidly since the second half of the 1990s, while those of not only the U.S. but also Japan, the U.K., Germany, and France have been declining. As of 2011 (average of 2010 to 2012 (PY)), the top three positions are held by the U.S., China, and Japan.
The next charts show changes in the shares of the numbers of adjusted top 10% papers and adjusted top 1% papers as qualitative indicators. Like the number of papers, the U.S. once again has shares that far exceed those of the other countries. However, it is apparent that the U.S. has far higher shares of the numbers of adjusted top 10% papers and adjusted top 1% papers. However, these shares have been on a continuous and gradual downward track since the 1980s. On the other hand, the growth of China's shares for both the numbers of adjusted top 10% papers and adjusted top 1% papers has been remarkable since the second half of the 1990s. Japan saw its shares increase gradually from the 1980s into to the early 2000s; however, these shares have been decreasing rapidly since then. Meanwhile, Germany has gained attention for steadily increasing its shares, particularly of the number of adjusted top 1% papers since the 1980s. Amid such time-series changes among the countries, as of 2011 (average of 2010 to 2012), Japan ranked sixth behind the U.S., China, U.K., Germany, and France in terms of number of adjusted top 10% papers, and ranked 7th behind the U.S., China, U.K., Germany, France, and Canada in terms of number of adjusted top 1% papers.
(All fields, fractional counting, three-year moving average)
Note:
The analysis targeted articles and reviews. Publication year (PY) was used in annual aggregation. Three-year moving averages of share of papers in all fields (if 2011, average of PY 2010, PY 2011, and PY 2012). Fractional counting used. Numbers of times cited are values as of the end of 2013.
Source:
Compiled by NISTEP based on Thomson Reuters, “Web of Science (SCIE, CPCI: Science)”
4.1.3 Characteristics of the research activities of selected countries
(1) International field balance in the world
While there are a variety of fields of research activities, the number of papers and the number of times cited are influenced by whether emphasis is placed on the production of papers in each field of research activities, by whether the number of researchers is large or small, and by whether the numbers of past papers that each paper refers to is large or small on average. Therefore, in the case of comparing countries, it is also important not only to look at the total number of papers and the number of times cited but also to understand the research activities of each field.
Note:
The analysis targeted articles and reviews. Fractional counting used. The fields are in accordance with the note of Chart 4-1-4 (B). Publication year (PY) was used in annual aggregation.
Source:
Compiled by NISTEP based on Thomson Reuters, “Web of Science (SCIE, CPCI: Science)”
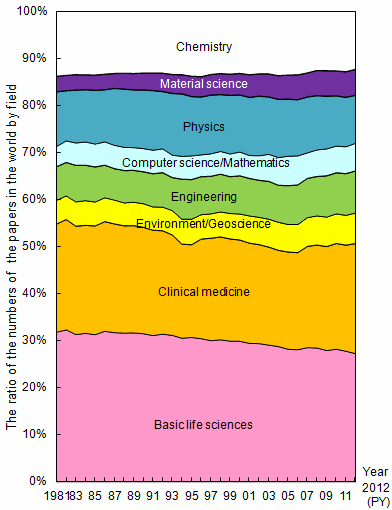
First, Chart 4-1-8 shows the change in the ratio of the numbers of papers which each field occupies throughout the world. Comparing 2012 with 1981, basic life sciences have fallen by 4.2 percentage points, chemistry by 1.3 percentage points, and physics by 1.3 percentage points. On the other hand, material science has increased its share by 2.2 percentage points, engineering by 1.8 percentage points, environment/geoscience by 1.4 percentage points, computer science/mathematics by 1.6 percentage points and clinical medicine by 0.6 percentage points.
Although there have been minor changes, the life science related fields such as Basic life sciences and Clinical medicine have retained their characteristic of accounting for about half of all papers.
(2) Field balances of the selected countries
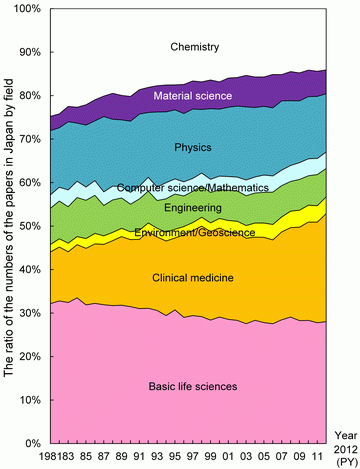
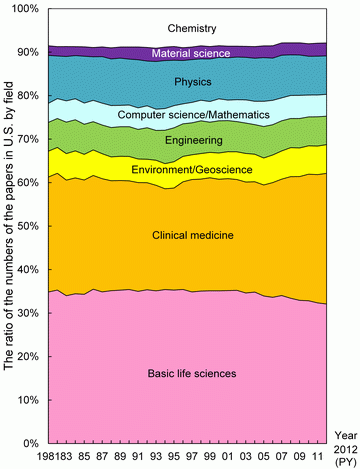
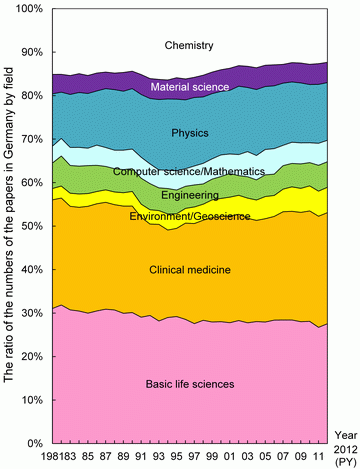
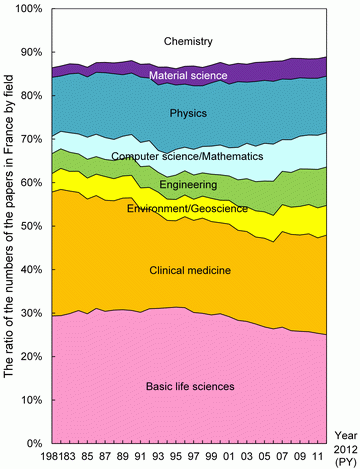
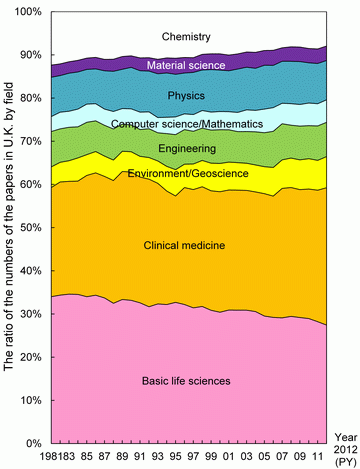
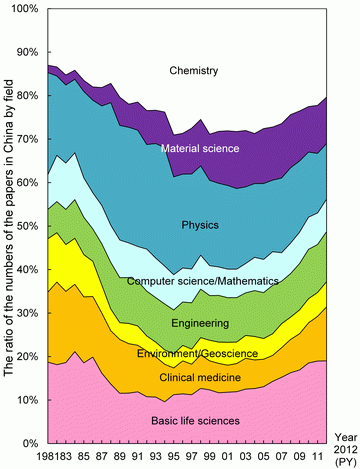
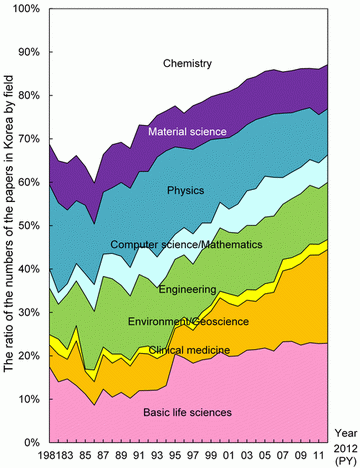
Next, Chart 4-1-9 shows changes in the field balances of the selected countries in order to provide a look at the domestic makeup of those countries. It should be noted that the shares for each field within the counties were obtained with fractional counting.
In Japan, basic life sciences, chemistry and physics accounted for large shares in the early 1980s. Comparing 2012 with 1981, however, chemistry has fallen by 9.9 percentage points and basic life sciences by 3.1 percentage points. On the other hand, clinical medicine increased its share 13.3 percentage point share, and environment/geoscience and material science have expanded by approximately 2 percentage points.
In the U.S., a change is seen in clinical medicine (3.4 percentage point increase).
In Germany, changes are seen in basic life sciences (3.3 percentage point decrease) and environment/geoscience (3.2 point increase).
In France, changes are seen in clinical medicine (5.5 percentage point decrease), basic life sciences (4.2 point decrease), engineering (4.2 point increase), and computer science/mathematics (3.9 point increase).
In the U.K., changes are seen in basic life sciences (6.7 percentage point decrease), chemistry (4.4 point decrease), and clinical medicine (5.9 point increase).
As for China, its shares for the life sciences (basic life sciences and clinical medicine) are lower than those of the other selected nations.
Note:
The analysis targeted articles and reviews. Fractional counting used. The fields are in accordance with the note of Chart 4-1-4 (B). Publication year (PY) was used in annual aggregation.
Source:
Compiled by NISTEP based on Thomson Reuters, “Web of Science (SCIE, CPCI: Science)”
(3) Field balances of selected countries in the world
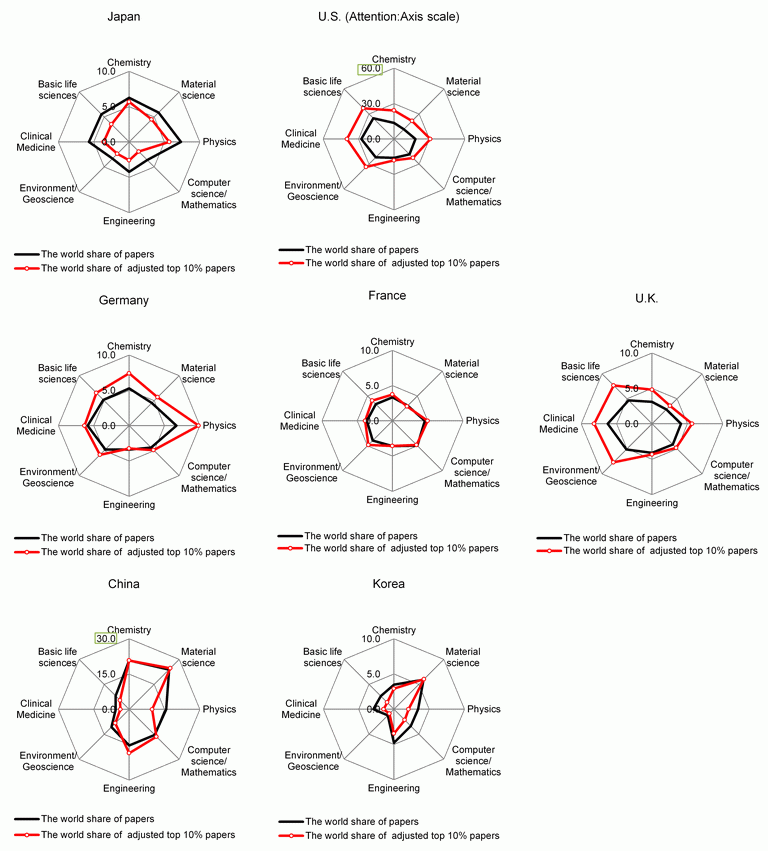
Chart 4-1-10 shows the field balances of the selected countries in the world. Field portfolios (2010 to 2012 (PY), fractional counting) were compared in terms of their shares of the number of papers and number of adjusted top 10% papers of the selected countries.
Japan has a portfolio in which the weights of physics, chemistry and material science are heavy, while those of computer science/mathematics, environment/geoscience, and engineering are light. In Chart 4-1-9 (A), the share of Clinical medicine in Japan's papers is shown to have increased, and the share of Chemistry and Basic life sciences has declined. However, when it comes to the share against the numbers of papers for each field in the world, it can be seen that Chemistry is higher than Clinical medicine in Japan.
The U.S. and U.K. are strong in clinical medicine, basic life sciences, and environment/geoscience; Germany is strong in chemistry and physics; and France is strong in physics, computer science/mathematics, and environment/geoscience. China has a particularly strong presence in both the paper shares and adjusted top 10% papers shares in material science, chemistry, computer science/mathematics, and engineering.
Comparing paper shares and adjusted top 10% papers shares shows that countries are divided into those having higher adjusted top 10% paper shares than paper shares in many fields (the U.S., Germany, France, and the U.K.) and those having lower adjusted top 10% paper shares than paper shares (Japan and Korea) in many fields. Looking at the adjusted top 10% paper shares, the strengths and weaknesses of each country are highlighted by their field balances in terms of paper shares.
(%, 2010-2012 [PY], fractional counting)
Note:
The analysis targeted articles and reviews; analysis is based on fractional counting. The fields are in accordance with the note of Chart 4-1-4 (B). Publication year (PY) was used in annual aggregation. Numbers of times cited are values as of the end of 2013.
Source:
Compiled by NISTEP based on Thomson Reuters “Web of Science” (SCIE, CPCI: Science)
Technical Notes: Regarding modification of the paper analysis method
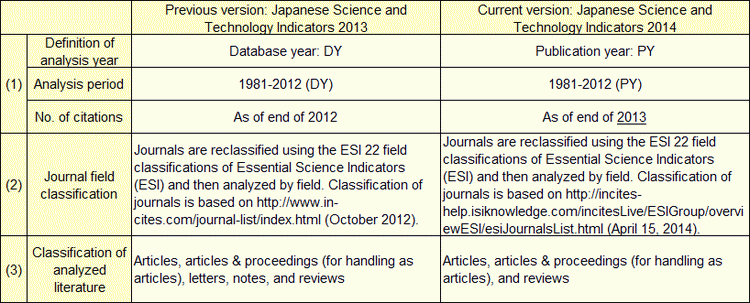
The following three changes were made to the analysis reported in 4.1 “Scientific Papers” of Chapter 4 “The output of R&D” of the Science and Technology Indicators 2014.
(1) Change in the definition of “year”
Up to the previous version “Science and Technology Indicators 2013,” Database Year (DY) was used as the “analysis year.” “DY” refers to the year in which a paper was registered in Thomson Reuters, “Web of Science.” DY is a concept that has long been used in scientometric analysis, beginning from the time that worldwide bibliographic data were first compiled into books and CD-ROMs on a year-by-year basis. However, in today's world, Internet-based retrieval databases are constantly being updated, and the Publication Years (PY) of journals in which particular papers appeared are being used by increasing numbers of database users (e.g., researchers, etc.) when conducting searches. Accordingly, Thomson Reuters executed a policy change that moves away from use of DY and toward use of PY.
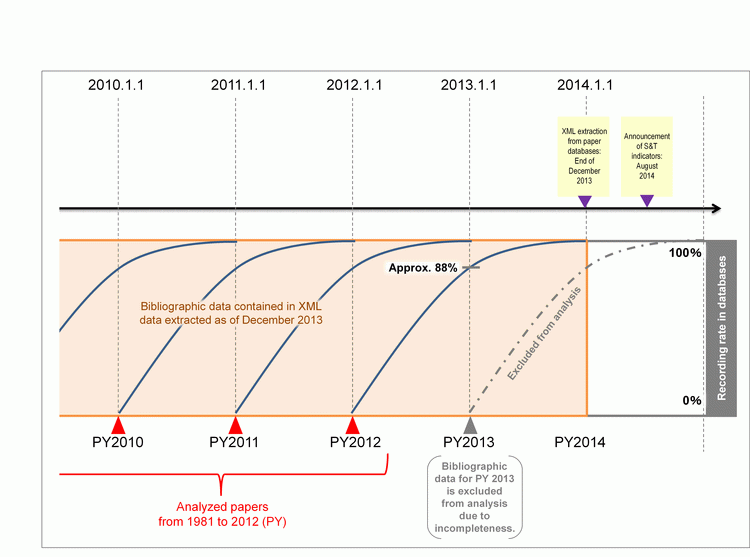
NISTEP conducted a study of methods for analyzing papers in line with the shift from DY to PY.
When it examined the circumstances by which bibliographic data of each year (PY) are recorded in paper databases, it found that, in the case of bibliographic data for 2010 (PY), for example, approximately 90% are recorded at the end of December 2010 and the remaining roughly 10% are recorded over the span of the following year. When it conducted a check of other years (PY), it obtained the same result. NISTEP extracted Web of Science's XML at the end of December 2013. Almost all bibliographic data for 2012 (PY) are recorded and 90% of data for 2013 (PY) are recorded at this stage. Accordingly, it was decided that analysis would be limited to bibliographic data for the period between 1981 and 2012 (PY).
As for number of times cited, it should be noted that those with longer periods of time since paper publication produce more stable results. Thus, it was decided to use numbers of times cited as of the end of 2013.
(2) Change in journal field classification
The “Science and Technology Indicators” uses the ESI 22 classification fields for journals appearing in Thomson Reuters. NISTEP reclassifies the Web of Science and conducts analyses by field. In the latter half of 2013, a major change was made to the sorting of journals under the ESI 22 field classification in Thomson Reuters.
For example, under the ESI 22 field classification used previously, some of the journals that had been sorted under clinical medicine were placed under NEUROSCIENCE & BEHAVIOR or other fields within the current ESI 22 field classification, and journals that had been sorted under engineering previously were placed under chemistry, computer science/mathematics, or other fields.
(3) Changes to the types of literature targeted for analysis
The types of literature targeted for analysis are articles, articles & proceedings (for handling as articles, and reviews. In recent years, notes have not been included among targeted bibliographies, and Thomson Reuters does not use letters in its analyses; therefore these items have been removed from the scope of our analysis. It should be noted that journals that include the word “letter” in their title (e.g., Physical Review Letter, etc.) are usually classified as articles in bibliographic databases, they are included in the analysis.


