3.5 Foreign students in institutions of higher education
Key points
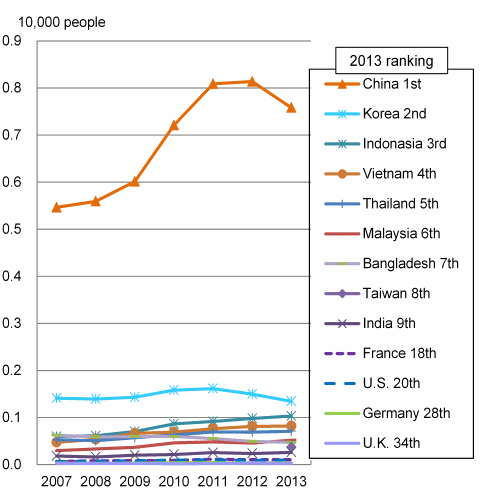
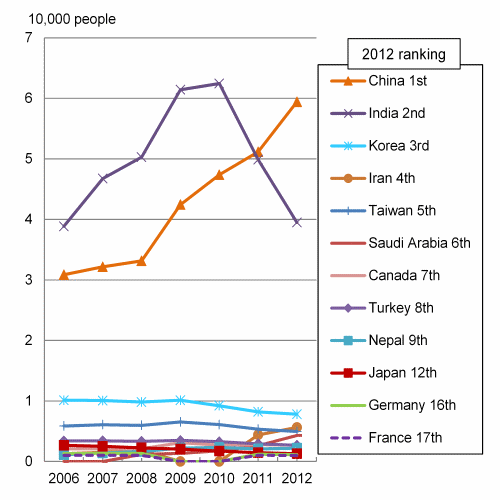
- Foreign graduate students in the natural sciences fields in Japan totaled 16,000 (2013). Of these, Chinese graduate students accounted for the largest share of this number with 8,000, which was half the total. On the other hand, the U.S. had 163,000 foreign graduate students in the science and engineering fields (2012). Of these, Chinese and Indian graduate students had the largest shares, accounting for a combined total of more than half.
- As for where the most foreign students from the different countries enroll in institutions of higher education, the U.S. accounts for the largest numbers of students from Japan, China and Korea. The largest numbers of students from Germany and France are enrolled in the U.K. The largest number of students from the U.K. is in the U.S., and the largest number of students from the U.S. is in the U.K.
3.5.1 Foreign graduate students in Japan and the U.S. This section discusses the state of foreign students in graduate schools, which train researchers and advanced specialist.
These foreign graduate students can be considered an indicator of globalization in higher education. Chart 3-5-1 shows the numbers of foreign students enrolled in graduate schools in Japan and the U.S. in terms of countries ranking in the top ten for the latest available year and selected countries. The fields are “natural science and engineering” in Japan and “science and engineering” in the U.S.
The chart shows that the number of foreign graduate students in Japan has been declining gradually since peaking in 2011. A breakdown reveals that Chinese graduate students accounted for the largest share, accounting for half of the total, or roughly 8,000, in the latest available year. There was a considerable gap between first place and second and lower places, with the next highest total being 1,000 (from North and South Korea). On the other hand, the number of foreign graduate students in the U.S. has been falling since peaking in 2010. A breakdown reveals that Indian graduate students had accounted for the largest share, although Chinese graduate students surpassed them in the latest available year. While the gap between the first and second places is not as large as that seen in Japan, there is a substantial gap between them and the third and lower places.
Graduate students from the European countries of Germany, the U.K. and France are consistently absent from the top 10 in both Japan and the U.S.
Note:
1) For Japan, foreign students are those without Japanese citizenship. For the U.S., foreign students are those without U.S. citizenship.
Sources:
<Japan> MEXT, “Report on School Basic Survey”
<U.S.> NSF, “Science and Engineering Indicators 2006, 2008, 2010, 2012”
3.5.2 Foreign students in institutions of higher education in selected countries
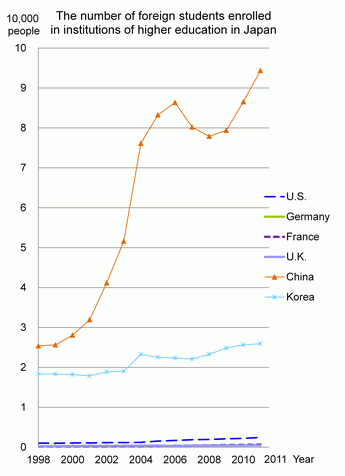
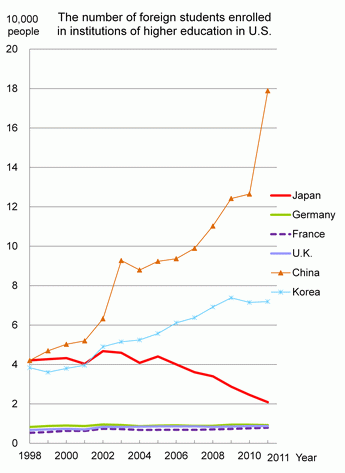
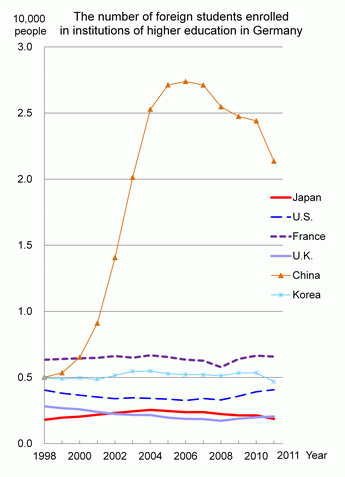
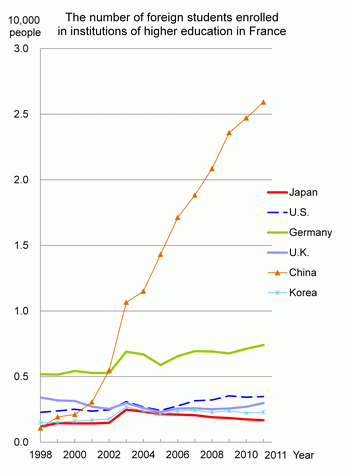
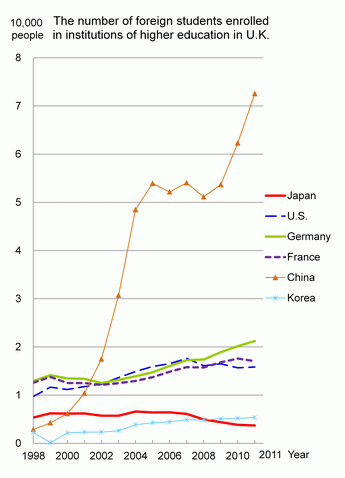
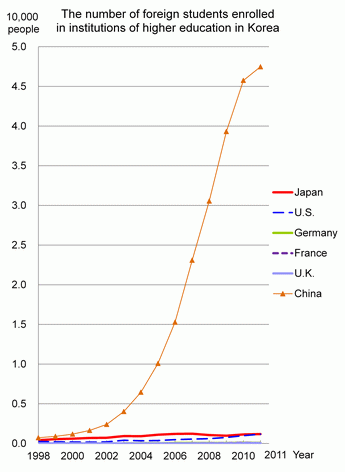
Chart 3-5-2 shows changes in the number of foreign students at institutions of higher education in each country. As used here, “foreign students” are students who are “not citizens of their host countries” (including international students). Although trends in their numbers do not change as much as those of international students, the degree to which students from different countries have a presence in various countries is examined.
Turning first to Japan's situation, in 2011, the largest number of foreign students was from China, at 94,000. It was followed by Korea, with about 26,000 students in Japan. In contrast, there were 2,000 students from the U.S., and approximately 500 each from Germany and the U.K. Looking at trends, China has continued to grow at a rate that far exceeds the others. It has showed record high numbers in recent years, despite a brief lag in 2008. The other countries are also showing increasing numbers, albeit at lower levels.
Looking at the situation in the U.S., Chinese students accounted for the largest number in 2011 at 179,000. This number was followed by Korea with 72,000 students, and Japan with 21,000. The numbers of students from both China and Korea have been increasing, but the number from Japan has been decreasing. Although there were about 21,000 students from Japan in the U.S. during 2011, there were far fewer, less than 10,000, from Europe.
In Germany as well, Chinese students accounted for the highest number, with 21,000 in 2011. The trend, however, has been downward since about 2006. French students account for the next largest number, with 7,000. At 5,000, the number of Korean students is also large. Japanese students numbered about 2,000.
Chinese students also account for the largest number in France, with 26,000 in 2011, and the number has been increasing. German students account for the next largest number, with 7,000. All the other selected countries had roughly similar numbers of students in France, i.e., about 2,000?3,000 each.
Even in the case of the U.K., China accounted for the highest number of students, exceeding 73,000 in 2011. German students accounted for the next largest number, with 21,000. The number of students from Japan has been on a downward trend during recent years. There were 4,000 Japanese students in the U.K. during the most recent available year.
There are also many Chinese students in Korea. Their number reached 47,000 in 2011 and is continuing to show consistent growth. The next largest number of students was from Japan, but they only numbered about 1,000.
As for where the most foreign students from the different countries enroll in institutions of higher education, the U.S. accounts for the largest numbers of students from Japan, China and Korea. The largest numbers of students from Germany and France are enrolled in the U.K. The largest number of students from the U.K. is in the U.S., and the largest number of students from the U.S. is in the U.K.
Note:
Foreign students are students who are not citizens of their host countries.
For the U.S., numbers are for foreign students through 2003 and for international students (non-citizen students without permanent or long-term residency) from 2004 on.
Sources:
OECD Stat (via internet)
Column: Ranking of the medal count in the International Science Olympiad
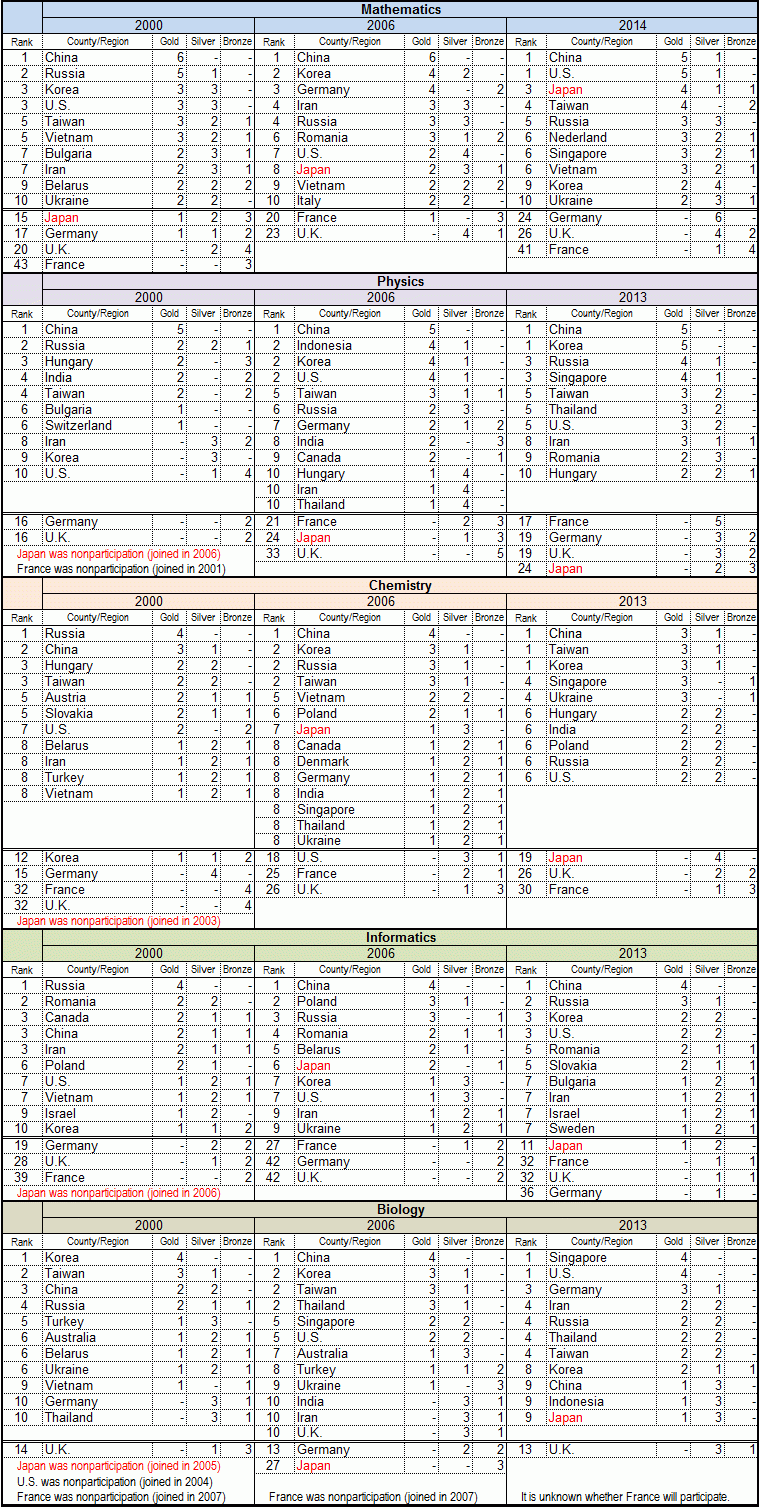
The International Science Olympiads are international competitions in science and technology for secondary students in participating countries. Their purposes are to find talented students in various countries and provide them with opportunities to develop their talents, to facilitate international interactions among students and educators and to promote the development of the relevant research areas. The results of each Olympiad are generally announced by the host country's secretariat. They are not collected in one source. The results of the Olympiads in mathematics, physics, chemistry, biology and informatics have therefore been collected here for comparison at three time points.
In the International Science Olympiads, more than one set of medals is awarded. The number of Gold, Silver and Bronze Medals awarded and the number of participants vary by Olympiad. The order of the rankings used here is determined by the number of Gold Medals won by each country. In the event of a tie in Gold Medals, rank is determined by the number of Silver Medals, and then Bronze Medals if necessary. In the event a tie is still not broken, the countries are assigned the same rank and listed in alphabetical order. The performances of major countries appearing in the Science and Technology Indicators, such as Japan, the U.S., Germany, France, the U.K., China and Korea, is noted even when they fall outside the top 10.
Looking at Chart 3-6-1, in each Olympiad the performances of East Asian nations such as China and Korea stand out. Countries such as Iran and Vietnam began appearing in the top 10 in 2000.
As for Europe, Russia and other Eastern European nations appear in the top 10 more often than Western European nations (Germany, France and the U.K.) do. Countries such as Romania and Belarus also began appearing often in the top 10 in 2000. The U.S. appears in the top 10 in almost every Olympiad.
Japan only began participating in all the Olympiads in recent years. It began participating in the Mathematical Olympiad in 1990, but it first joined in the International Physics Olympiad in 2006 and in the International Chemistry Olympiad in 2003. Japan participated in the International Olympiad in Informatics from 1994 through 1997, but then stopped before joining in again starting in 2006. It began participating in the International Biology Olympiad in 2005.
Japan thus began participating later than other countries did. However, it has posted excellent results, usually finishing in the top 10 in each Olympiad.
Japan began a support program for this type of international science and technology competition in 2004. Its goals are to provide outstanding math and science students with opportunities to learn and to contribute to the fostering of future researchers who can meet international standards. In addition, the program supports the holding of international science and technology competitions themselves. In light of the decision to hold the Olympic and Paralympic Games in Tokyo in 2020, there is a proposal being promoted to hold the International Science Olympiad in Japan at the same time (according to Yume Vision 2020 [MEXT version]).
(Yumiko Kanda)
Note:
Team sizes for the various Olympiads are six people or fewer for Mathematics, five or fewer for Physics, four or fewer for Chemistry, four or fewer for Biology and four or fewer for Informatics.
Sources:
Each Olympiad's website created by NISTEP.

