5.5 Total Factor Productivity (TFP)
Key points
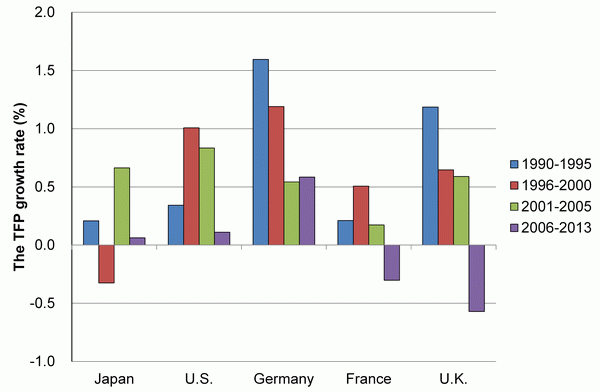
- Looking at Total Factor Productivity (TFP), which is used as an indicator showing the contribution of technological progress to economic growth, Japan's TFP growth rate was a negative figure during the latter half of the 1990s. While Japan's rate rose to a comparatively high level in the early 2000s, it fell again in the latter half of the 2000s.
Total Factor Productivity (TFP) is an indicator showing that portion of economic growth that cannot be explained by the contributions of increased investment in capital and labor. TFP indicates the degree to which improved production efficiency contributes to economic growth (GDP increase). This is likely to include the effects not only of technological progress, but also of factors such as improvements in management and organizational efficiency, the development of divisions of labor, the achievement of economies of scale and the preservation of excess labor and capital due to recession. Thus, although TFP is not an indicator that directly measures technological progress, over the long term such progress has a relatively powerful effect on it. TFP is therefore widely used as an indicator of the contribution of technological progress on economic growth.
Chart 5-5-1 shows an example of TFP measurement of entire national economies on a macro basis. This is based on a methodology that has come into general use in recent years (the so-called KLEMS methodology), which aims to measure productivity improvement as accurately as possible by taking improvements in the quality of labor and capital service into account.
Japan's TFP growth rate was a negative figure during the latter half of the 1990s. While Japan's rate rose to a comparatively high level in the early 2000s, it fell again in the latter half of the 2000s.
The U.S. had a high TFP growth rate from the late 1990s through the early 2000s, but this rate fell in the second half of the 2000s.
Germany's TFP growth rate was higher than the others in the 1990s but has not reached the same level since entering the 2000s.
France's TFP growth rate was high in the latter half of the 1990s but declined in the first half of the 2000s. It became a negative figure in the second half of the 2000s.
The U.K.'s TFP growth rate was high in the first half of the 1990s but has fallen below the levels achieved then in subsequent years. The rate became a negative figure in the second half of the 2000s.

Note:
The TFP growth rate for each period is the average annual rate for that period. (For example, for 1990-1995 it is the average of the year-on-year growth rates for 1990, 1991, 1992, 1993, 1994 and 1995.)
Source:
Created from the Conference Board Total Economy Database™, January 2014, http://www.conference-board.org/data/economydatabase/ .
Column: Changes in the TFP index
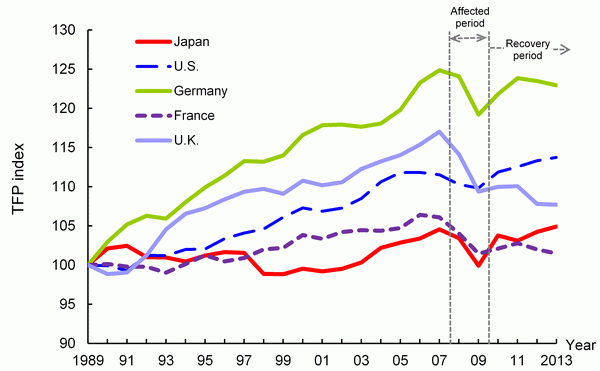
Chart 5-5-1 in the main text shows changes in the Total Factor Productivity (TFP) growth rate in selected countries in terms of averages of multiple years. At the same time, however, TFP can be used as a relative value (index) based on specific years. Here, the author obtained the TFP index by using the year prior to the start of measurement (specifically, 1989) as the base year, giving that year a base value of 100, and then multiplying this value by sequentially obtained growth rates.
The TFP index that was obtained in this way is an relative value and does not show absolute value. For example, Germany has a large value. However, this value shows that growth from the base is large, and therefore does not in any way show that the absolute value for Total Factor Productivity is large.
In other words, the TPF index shows the degree to which TFP is high or low compared to the base year.
Chart 5-5-2 shows changes in the TFP index that was obtained in the manner described above. First, it is clear that, for all of the countries, index trends changed greatly before and after 2007. It goes without saying that this was an effect of the economic shock caused by Lehman Brothers' bankruptcy.

Source:
Same as for Table 5-5-1
For all of the countries, the TFP index was rising up to 2007. The country with the largest growth rate was Germany (average annual growth rate of 1.25%; hereafter the same). Following are the U.K., the U.S., and France. Each had seen decreases or very small increases until 1992 and 1993 before entering full-scale upward trends in subsequent years (0.81%, 0.70%, 0.50%, respectively). Japan shows a trend that is substantially unlike those of the other countries. Its TFP index rose until 1991 and then fell before flattening out from 1992 to 1997 (0.11%). It then fell again and then rose between 1998 and 2007 (0.63%).
Since 2007, the U.S. had the smallest rate of decline (-0.76%) in its TFP index for the years 2007 to 2009 (called the “affected period” ), and the second largest growth rate (0.88%) for the subsequent years of 2009 to 2013 (called the “recovery period” ). This shows that the U.S. (which was the epicenter of the “Lehman shock” ) received only a small impact from the crisis compared to the other developed countries. On the other hand, the U.K. had the largest rate of decline for the affected period (-3.32%) and has not been able to return to growth in subsequent years (-0.38). Japan's rate of decline for the affected period (2.24%) was roughly the same as those of Germany and France, but its growth rate for the recovery period was the largest (1.24%). It should be noted that, during the affected period, all of the countries (with the exception of the U.S.) had larger rates of decline in 2009 than 2008. This suggests that the effects of the “Lehman shock,” which occurred in September 2008, were more greatly felt in the following year than in 2008.
(Fujio Niwa)

