5.3 Trademark applications and trilateral patent families
Key points
- The number of trademark applications is related to innovation in the form of new products and services, and to associated marketing activities. It can thus be considered data that reflect the relationship between innovation and markets. By examining that number along with the number of patent applications, which indicates the technical aspects of innovation, the nature of innovation in each country can be grasped.
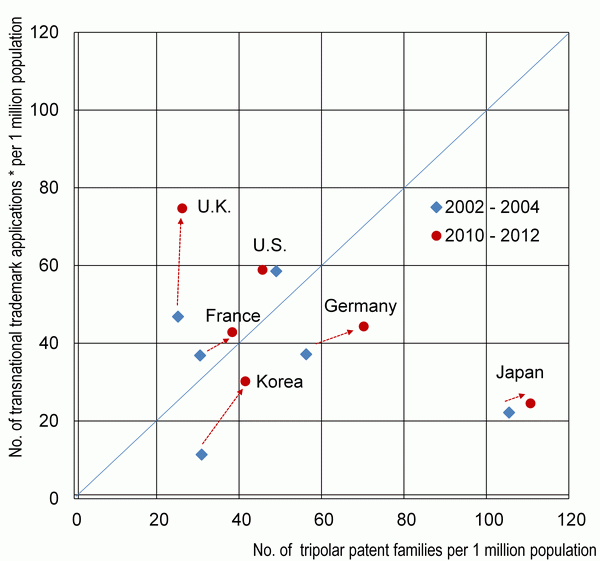
- Looking at the number of transnational trademark applications and trilateral patent families (patents with the same content submitted in Japan, the U.S. and Europe) per million population , in 2010-2012, Japan had high numbers of trilateral patent families but relatively low numbers of trademark applications. Korea also had a relatively low number of trademark applications. Germany had a large number of trilateral patent families, but its number of trademark applications was not small. The U.S., France, and the U.K., on the other hand, had more trademark applications than trilateral patent families.
Chart 5-3 shows the number of transnational trademark applications and the number of trilateral patent families in selected countries. Both values are standardized by population for each country.
When business enterprises bring new products or services to the market, they apply for trademarks in order to distinguish them from market competitors. Thus, the number of trademark applications is related to the realization of innovation in the form of new products and services, and to associated marketing activities. In that sense, it can be considered data that reflect the relationship between innovation and markets.
Transnational applications as used here are applications for trademarks in foreign countries. When applying for a trademark, there is a strong tendency to apply for it in the home country. In addition, because there are differences in the number of applications because of factors such as national size and systems, values were corrected using the number of applications from Japan, Germany, France, the U.K. and Korea to the U.S. Patent and Trademark Office and from the U.S. to Japan and Europe (See Chart 5-3, Note: 1.).
Patents are used as an indicator of countries' technological prowess. Bias is introduced because there are advantages to filing patent applications in one's own country and because of the influence of geography. The number of trilateral patent families was used because it is less susceptible to such effects.
Looking at the situation for the years 2010 to 2012, Japan, Germany, and Korea had more trilateral patent families than trademark applications. This result was particularly conspicuous in the case of Japan.
The U.S., France, and the U.K., on the other hand, had more trademark applications than trilateral patent families. This was particularly true in the case of the U.K.
It is believed that countries with powerful manufacturing industries or those specializing in the information and communications industry tend to have more patent applications than trademark applications, while countries weighted towards service industries tend to have more trademark applications. Country characteristics may thus be appearing in the data.
Data on international applications was used for both trademarks and patent families. In Japan's case, because international business development differs in manufacturing industries and service industries, this may affect the data.
Next, a comparison of 2002 to 2004 with 2010 to 2012 shows no change in the balance between the number of trademark applications and number of trilateral patent families for all of the countries. However, Japan, France, and Korea have growing numbers of both trademark applications and patent families.
In the case of the U.S., the number of trademark applications remained unchanged while the number of trilateral patent families grew. In Germany, trademarks decreased while trilateral patent families grew. And in the U.K., trademarks grew while trilateral patent families decreased.

Notes:
1) *” Transnational trademark” refers to the following.
For the number of trademarks in Japan, Germany, France, the U.K. and Korea, the number filed with the U.S. Patent and Trademark Office (USPTO).
The number of trademarks for the U.S. is the average of (i) and (ii).
(i) The corrected number of the U.S. applications, based on the ratio of Japanese and the U.S. applications to the Office for Harmonization in the Internal Market (OHIM) = (number of the U.S. applications to the OHIM / number of Japanese applications to the OHIM) × number of Japanese applications to the USTPO.
(ii) The corrected number of the U.S. applications, based on the ratio of European and the U.S. applications to the Japan Patent Office (JPO) = (number of the U.S. applications to the JPO / number of EU-15 applications to the JPO) × number of EU-15 applications to the USTPO.
2) Three-year averages.
Sources:
Number of trademark applications: WIPO,” WIPO Statistics Database” (Last updated: January 2014)
Number of trilateral patent families: OECD, “Main Science and Technology Indicators 2013/2.”

