4.2 Patents
Key points
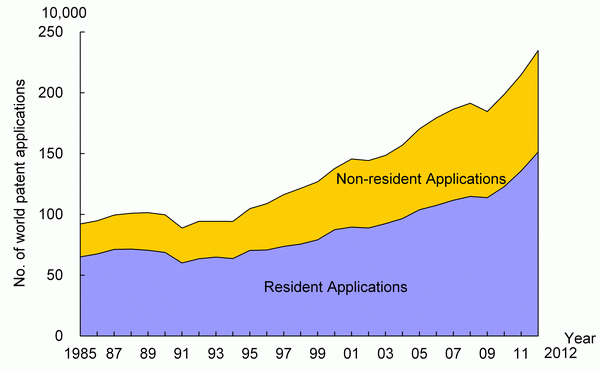
- The number of world patent applications showed a significant downturn in 2009 resulting from the economic downturn sparked by the Lehman Brothers’ bankruptcy. However, the number increased again from 2010 and reached 2.35 million in 2012.
- The number of annual applications to Japan has been on a downward trend since the mid-2000s. In 2009, in particular, the number of applications fell by roughly 10% compared with 2008. In 2012, the number was 340,000. Applications from residents account for approximately 80%.
- The number of applications to the U.S. had trended flat in recent years, but saw continuous increases between 2010 and 2012 to reach 540,000. The numbers of applications from residents and non-residents were roughly equal, accounting for one half each.
- The number of applications to China in 2012 reached 650,000, a figure that surpassed that of the U.S. Applications from residents accounted for approximately 80%. The number of applications made by applicants within China is showing particularly strong growth.
- Looking at applications from Japan, the U.S., China, and Korea, applications to the resident country are more frequent compared to applications to non-resident countries. In Japan, the number of applications to JPO in has been decreasing in recent years. It stood at 290,000 in 2012, which is approximately 75% of the peak year (2000).
- Looking at shares of patent family numbers, Japan and the U.S. traded places in ranking during the second half of the 1990s before Japan took the top share in the 2000s. This reflects the fact that the number of patent applications submitted from Japan to multiple countries increased.
- Looking at Japan's technology field balance as of 2009, Japan has high ratios in electrical engineering and general machinery in international comparison. On the other hand, Japan has lower weights in biotechnology/pharmaceuticals and bio/medical devices in international comparison.
- Looking at Japan, approximately 90% of its patent family applications went to the U.S. or Europe as of 1981; however, its applications to China have been increasing since the 1990s. As of 2008, applications to the U.S. accounted for 47%, those to China accounted for 20%, and those to the European Patent Office accounted for 13%.
4.2.1 The patent applications in the world
(1) The number of patent applications in the world
Section 4-2-1 uses “Statistics on Patents” issued by the WIPO (World Intellectual Property Organization); data are current as of November 2012. Chart 4-2-1 shows changes in the numbers of patent applications to about 230 countries and regions for which data are provided in WIPO's “Statistics on Patents.” Here, the applications are divided to show resident applications, which mean that the first applicants make applications directly to countries or regions in where they live, and Non-resident applications, which mean that the first applicants make applications to countries and regions where they do not have residency.
The numbers of patent applications include by both direct applications to patent authorities in each country or region; and PCT (Patent Cooperation Treaty) applications. As for PCT applications, applications have been transferred to the national/regional phase, were counted.
The number of world patent applications has increased at an average annual rate of about 5% since the mid-1990s. It stood at 2.35 million in 2012. Non-resident applications, which occupied about 30% in the mid 1980s, have increased more than that of resident applications at a rapid pace, and have occupied about 40% of the total numbers of applications in recent years.
The number of world patent applications showed a significant downturn in 2009 resulting from the economic downturn sparked by the Lehman Brothers’ bankruptcy. However, the number has been increasing again since 2010.
Note:
(1) Resident applications means that first applicants make applications directly to countries or regions in where they live or do PCT applications.
(2) Non-resident applications mean that applicants make applications directly to countries or regions in where they do not live or do PCT applications.
(3) PCT applications mean applications made through PCT (Patent Cooperation Treaty) international patent application.
Source:
WIPO,” WIPO Statistics Database” (Last updated: November 2012)
(2)The situation of patent applications in main countries
Next, the patent applications to and from the main countries are shown. Here, the patent applications to Japan, the U.S., Europe, China, Korea, Germany, France and the U.K. are covered. The patent applications to these eight patent authorities account for 84% of the patent applications in the entire world.
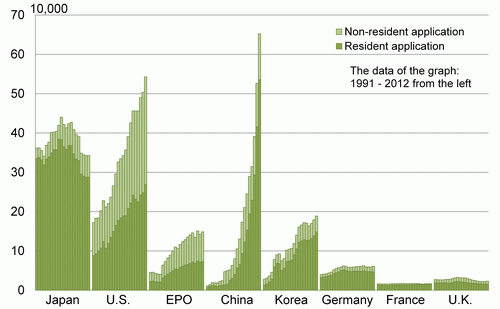
Chart 4-2-2 (A) breaks the number of applications to the selected countries into two categories: those from residents and those from non-residents. The chart shows that the number of annual applications to Japan is third after the U.S. and China, but has been on a downward trend since the mid-2000s. In 2009, in particular, the number of applications fell by roughly 10% compared with 2008. In 2012, the number was 340,000. Looking at the breakdown, the resident applications to the JPO from resident applicants, who have their residency in Japan, accounts for over 84%.
The number of applications to the U.S. had trended flat between 2007 and 2009, but saw continuous increases between 2010 and 2012 to reach 540,000. The numbers of applications from residents and non-residents were roughly equal, accounting for one half each. This is considered to show that the U.S. market is always attractive to overseas. The provisional application system was introduced in 1995. This system is thought to be a reason for the increase in application numbers.
The number of applications to the European Patent Office has been largely unchanged in recent years. It stood at approximately 150,000 in 2012. The numbers of applications to Germany, France, and the U.K. have not shown any major changes compared to other countries and have trended flat or down slightly for the most part. The fact that patent applications can be made to each country that has ratified the European Patent Convention through applications to the European Patent Office is likely accountable for the flat or downward trend in individual countries.
The number of applications to SIPO has drastically increased. They increased by an annual average of about 22% over 10 years (2003-2012). The number of applications in 2012 reached 650,000, a figure that surpassed that of the U.S. The number of applications from residents was about 50% in the first half of the 2000s, but in 2012 it was about 80%. This indicates that applications from applicants in China have especially increased.
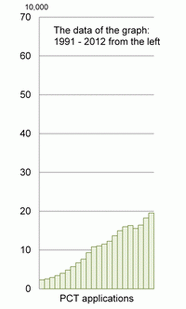
Chart 4-2-2 (B) shows numbers of PCT applications. PCT applications can be seen as a bundle of patent applications to the various patent authorities. One PCT application is the same as an application to multiple patent authorities. The number of PCT applications had seen little change from the mid-2000s; however, in 2012 it increased by 7% compared to 2011, reaching approximately 200,000.
(1991-2012)
patent applications (1991-2012)
Note:
The breakdown of numbers of applications corresponds to the following items in the case of applications to Japan.
“Applications from residents” : Applications made directly to the JPO by applicants who live in Japan
“Applications from non-residents” : Applications made directly to the JPO by applicants who live outside of Japan (for example, the U.S.)
Source:
WIPO,” WIPO Statistics Database” (Last updated: January 2014)
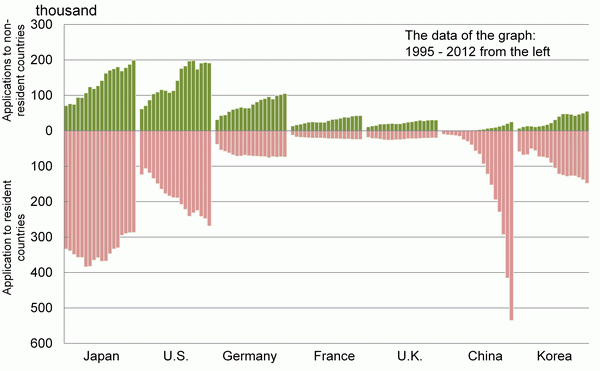
The next Chart shows the situation of patent applications from main countries (Chart 4-2-2 (C)). Here, the numbers of applications are divided into two categories and shown as applications to the country of residence and applications to a country of non-residence. Direct applications to patent authorities in each county or region; and PCT patent applications which are transferred to the national/regional phase were counted. In all countries, applications to the EPO were counted as non-resident applications.
This analysis calculates the number of applications for each country by using the country that the first applicant or assignee belongs to. For instance, if there is a joint application with an applicant (the first) in Japan and an applicant (the second) in the U.S., only Japan is counted.
In Japan, the U.S., China and Korea, there are more applications to the country of residence than there are to countries of non-residence. Approximately 60% of the total numbers of applications from Japan are to the JPO.
Looking at changes in the number of applications to a country of residence, the number for Japan has been decreasing in recent years. It stood at 290,000 in 2012, which is approximately 75% of the peak year (2000). The number for China has been growing remarkably, reaching 540,000 in 2012. The numbers for the U.S. and Korea have continued to rise since 2009. In Germany, France and the U.K., the numbers of applications to the country of residence have been almost flat or slightly decreased. One of the factors is considered to be that a certain number of patent applications, which have been applied for to the patent authorities of the country of residence, are now being applied for to the EPO.
Looking at the number of applications to a country of non-residence, the number of applications from Japan surpassed that from the U.S. in 2012 to reach approximately 200,000. The number of applications from the U.S. has been largely unchanged recent years. It deserves noting that China has been increasing its number of patent applications to the resident country, but its number to non-resident countries remains small at just 25,000 in 2012.
Note:
1) The breakdown of numbers of applications corresponds to the following items in the case of applications to Japan.
“Applications to country of residence” : Applications made to the JPO by applicants who live in Japan
“Applications to country of non-residence” : Applications made to a country other than Japan (for example, to the U.S. Patent and Trademark Office) by applicants who live in Japan
2) Every country includes the numbers of the applications to the EPO.
3) Includes PCT applications transferred domestically.
Source:
WIPO,” WIPO Statistics Database” (Last updated: January 2014)
4.2.2 International comparison of number of patent applications using patent families
One difficulty in international comparison of numbers of patent applications is the fact that patents are territorial, and thus applicants make applications to multiple countries when seeking to establish rights for an invention. Consequently, when counting patent applications from “Country A,” the possibility exists that duplicated patent applications to several countries are being counted. Additionally, when considering applications to Country A, there is a tendency for applications from Country A to have the largest share (the so-called “home advantage” ).
Given these characteristics of patent applications, the analysis here will be based on patent families in order to improve international comparability. The analysis was made using PATSTAT (October 2013 version) of the EPO (European Patent Office). Details concerning the method for patent family analysis are provided in the Technical Notes (see page 152). “Patent families” refers to groups of patent applications that are made to two or more countries that are tied directly or indirectly by priority rights. Ordinarily, patents for which applications with the same content are made to multiple countries belong to the same patent family. Accordingly, counting patent families makes it possible to prevent double counting of the same patent. In other words, it is thought that the number of patent families is roughly the same as the number of inventions.
Additionally, counting patent families makes it possible to make a collective count of applications to patent offices around the world, rather than just applications to specific countries. Although PCT application numbers are commonly used when making international comparisons of patent application numbers, PCT applications provide a limited view of overseas applications from a certain country. From the standpoint that it measures the number of inventions produced by each country in an internationally comparable form, analysis using patent families is thought to provide useful indicators when comparing the technical capabilities of each country.
The following presents two values. The first is a number that adds the number of patent applications to one country only (single-country applications) to the number of patent families (patent applications to two or more countries), and the other is the number of patent families. In the following discussion, the former will be referred to as “number of patent families + single-country applications” and the latter as “number of patent families.” In the case of a patent family, the application is submitted to two or more countries with the intention of protecting rights in countries outside that in which the inventor or applicant resides; thus, the invention is considered to have higher value than that for a single-country application.
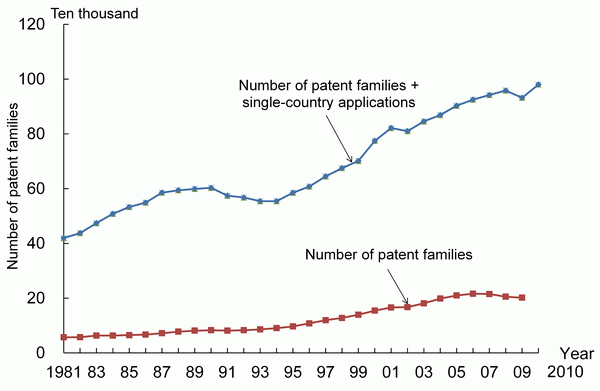
Chart 4-2-3 shows time-series changes in the number of patent families + single-country applications and number of patent families. The number of patent families + single-country applications, which stood at around 400,000 in 1981, saw gradual growth that brought it up to approximately 980,000 in 2010. The number of patent families stood at 57,000 in 1981 and approximately 200,000 in 2009. The percentage of the number of patent families in patent family + single-country applications was less than 15% in the 1980s; however, it has continued to grow gradually and exceeded 20% in recent years.
Note:
See the Technical Notes for details concerning the method used for patent family analysis.
Source:
Aggregated by NISTEP based on PATSTAT (October 2013 version) of the European Patent Office
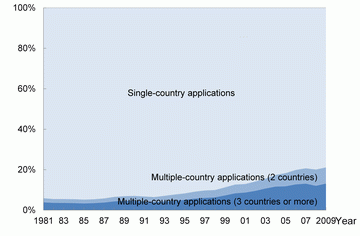
Chart 4-2-4 shows the percentages of single-country applications and multiple-country applications in the patent family + single-country applications of the selected countries. In Japan, approximately 95% were single-country applications in the first half of the 1980s. From the mid-1980s, the percentage of multiple-country applications grew gradually until, as of 2009, approximately 80% were single-country applications and approximately 20% were multiple-country applications.
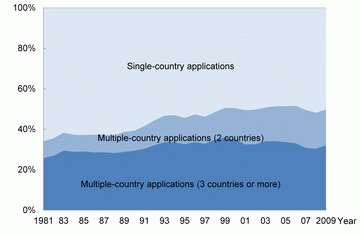
In the U.S., the percentages of single-country applications and multiple-country applications are both around 50%. This balance has not changed greatly since the second half of the 1990s.
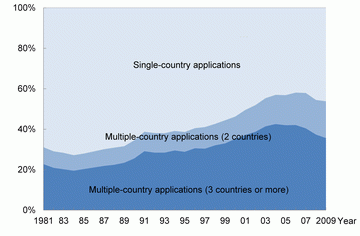
In Germany, France, and the U.K., each is seeing a long-term trend whereby the percentage of multiple-country applications is rising. Of the three, the country with the highest percentage of multiple-country applications is France. This percentage stood at 62% in 2009.
Like Japan, the percentages of multiple-country applications of China and Korea are not very high. Although there has been a degree of fluctuation in some years, as of 2009, the percentage for China stood at roughly 7% while that for Korea was roughly 16%.
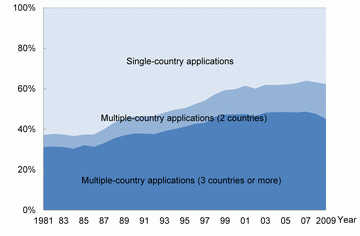
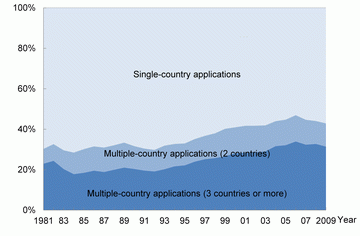
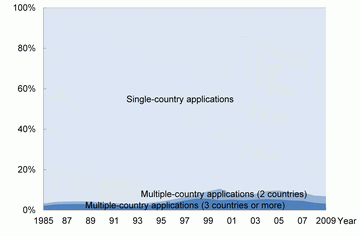
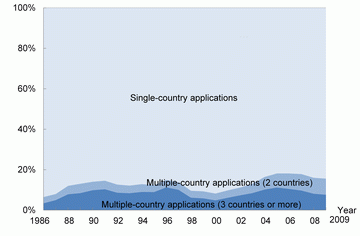
Note:
See the Technical Notes for details concerning the method used for patent family analysis.
Source:
Aggregated by NISTEP based on PATSTAT (October 2013 version) of the European Patent Office
4.2.3 Number of patent families, single-country applications and number of applications and number of patent families in each country/region
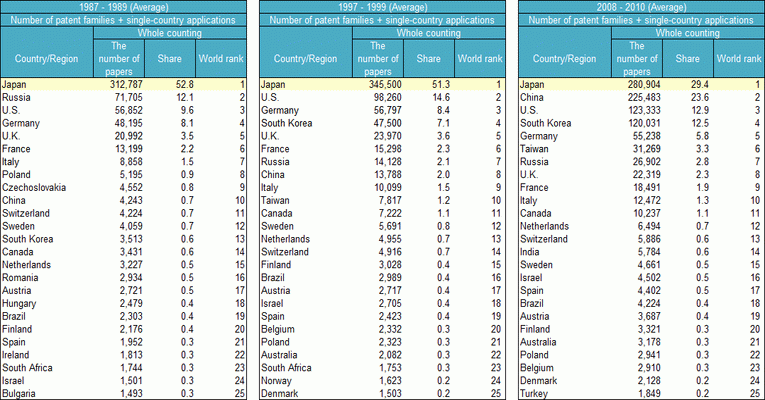
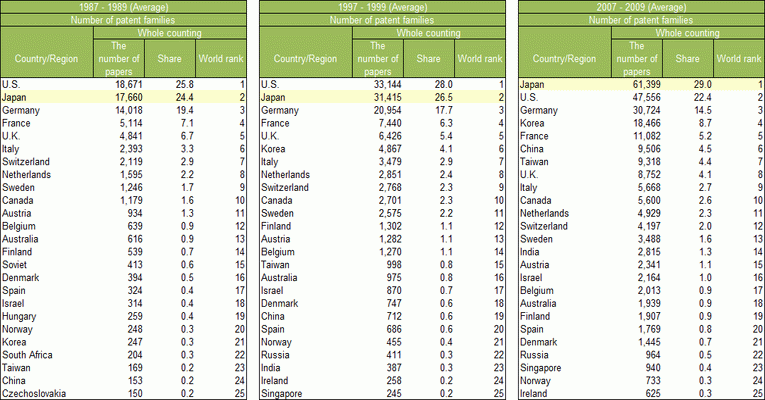
Chart 4-2-5 shows the number of patent families + single-country applications (A) and number of patent families (B) that were obtained with whole counting for each country and region.
Japan's number of patent families + single-country applications ranks No. 1 in all three time periods. For the 2008 to 2010 period, the next counties were, in order, China, the U.S., Korea, Germany, and Taiwan. The chart shows that the Asian countries and regions have rapidly moved up in rank during the past 20 years.
Looking at the number of patent families, throughout the 1980s and the 1990s, the U.S. ranked No. 1 and Japan ranked No. 2; however, entering the 2000s, Japan has ranked No. 1 and the U.S. No. 2.
From 1997-1999 to 2008 - 2010, Japan's number of patent families + single-country applications has been falling, while its number of patent families has been increasing. As is shown in Chart 4-2-4, this reflects the fact that the number of patent applications submitted from Japan to multiple countries increased.
Looking at the next countries beginning with the third spot, in the 2007 to 2009 period, these were Germany followed by Korea, France, China, and Taiwan. Although China is showing remarkable increases in terms of its number of patent families + single-country applications, as can be seen in Chart 4-2-4, the majority of applications are currently directed within China. Accordingly, China ranks below the U.S., Germany, and others in terms of number of patent families.
in each country/region: The top 25 countries/regions
(A) Number of patent families + single-country applications
Notes:
The number of applications for Australia is underestimated because the Australian patent office was excluded from aggregation. See the Technical Notes for details concerning the method used for patent family analysis.
Source:
Aggregated by NISTEP based on PATSTAT (October 2013 version) of the European Patent Office
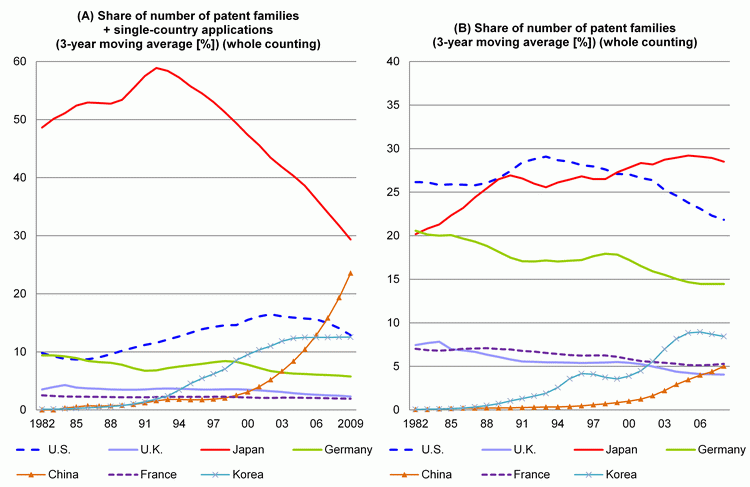
Chart 4-2-6 (A) compares each country's share of the number of patent families + single-country applications using whole counting in order to ascertain each country's application situation in quantitative terms.
First, looking at shares of the number of patent families + single-country applications, Japan consistently had a much larger share than the other countries from the 1980s into the early 1990s. In the first half of the 1990s, Japan's share approached 60%; however, this figure has been dropping rapidly since the mid-1990s. It stood at 29% as of 2009 (average of 2008 to 2010).
During this time, significance increases in share of the number of patent families + single-country applications have been seen in the U.S. since the second half of the 1980s, Korea since the first half of the 1990s, and China since the second half of the 1990s.
As China has rapidly increased its share of the number of patent families + single-country applications, all of the other selected countries (with the exception of Korea) have had decreasing trends in their shares since entering the 2000s. As of 2009, the top three positions are held by Japan, China, and the U.S.
Next is an examination of changes in the number of patent families, which carries a qualitative aspect (Chart 4-2-6 (B)). Looking first at shares of the number of patent families, the U.S. maintained a 25% or greater share throughout the 1980s and 1990s; however, its share has been falling since the 2000s. Japan overtook the U.S. during the second half of the 1990s before Japan took the top share in the 2000s. Its share stood at 29% as of 2008.
Germany's share of the number of patent families resembled that of Japan during the first half of the 1980s but subsequently entered a gradual decline. Nonetheless, it ranked third behind the U.S. in 2008.
Korea's share began growing from the second half of the 1980s. This growth temporarily stopped in the second half of the 1990s but began again from the early 2000s. Korea's share has been largely unchanged in recent years.
China's share of the number of patent families has continued to grow since the first half of the 2000s. However, this growth has been slow compared to its share of the number of patent families + single-country applications. As of 2008, China had a 5% share of the number of patent families.
and number of patent families among the selected countries
(All technical fields, whole counting, three-year moving average)
Notes:
Three-year moving averages of share of number of patent families in all technical fields (if 2008, the average of 2007, 2008, and 2009); see the Technical Notes for details concerning the method used for patent family analysis.
Source:
Aggregated by NISTEP based on PATSTAT (October 2013 version) of the European Patent Office
Because patent systems differ from country to country, numbers of patent families + single-country applications that include applications made only to the countries of residence of inventors and applicants are considered to have high dependency on the patent system of individual countries.
On the other hand, in the case of patent families, applications are thought to be submitted to two or more countries with the intention of protecting rights in countries outside those in which the inventor or applicant resides; thus, their inventions are considered to have relatively higher value among the number of patent families + single-country applications. Given this, the following analysis uses patent families.
4.2.4 Technology field characteristics of patent applications of the selected countries
(1) Technology field balance in all patent families
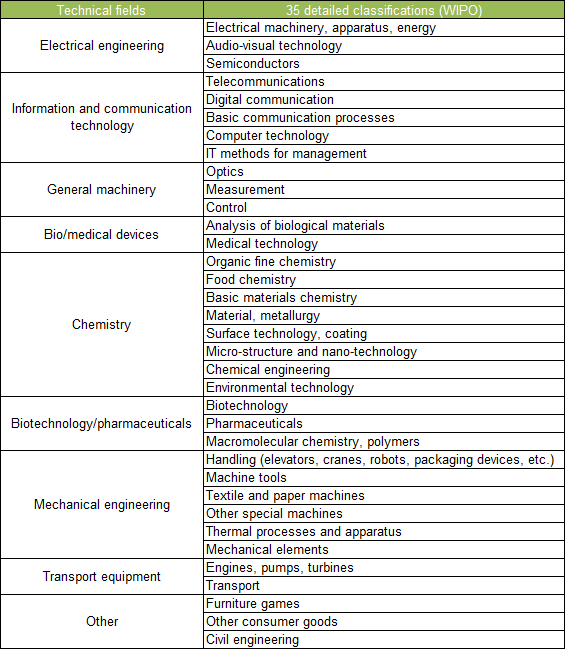
This section discusses the results of an analysis of the number of patent families in individual technology field. For classification of technology field, technology field and correspondence tables of the International Patent Classification (IPC) presented by WIPO were used. As is shown in Chart 4-2-7, WIPO's technology field is classified into 35 detailed classifications. These were compiled into nine technology field for the purposes of this analysis.
Note:
See the Technical Notes for details concerning the method used for patent family analysis.
Source:
Classified by NISTEP based on WIPO, IPC-Technology Concordance Table
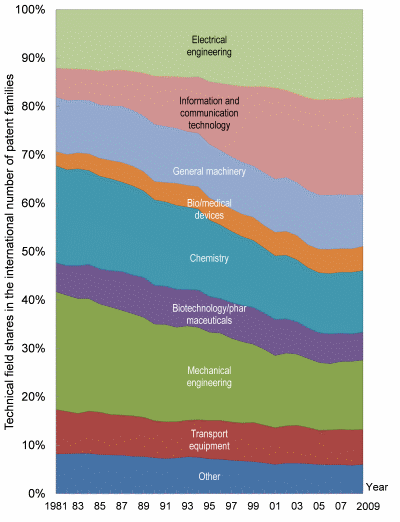
First, Chart 4-2-8 shows changes in balance of technology fields in all patent families. A comparison of 1981 and 2009 shows that mechanical engineering declined by 10 percentage points and chemistry declined by 7.3 percentage points. On the other hand, information and communication technology grew by 14 percentage points and electrical engineering grew by 6.1 points. It is apparent that the share of information and communication technology has grown particularly rapidly since the early 1990s.
Note:
See the Technical Notes for details concerning the method used for patent family analysis.
Source:
Aggregated by NISTEP based on PATSTAT (October 2013 version) of the European Patent Office
(2) Technology field balances in the selected countries
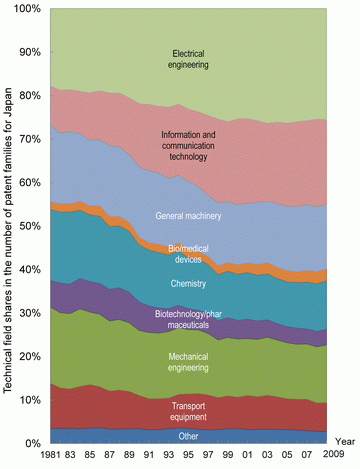
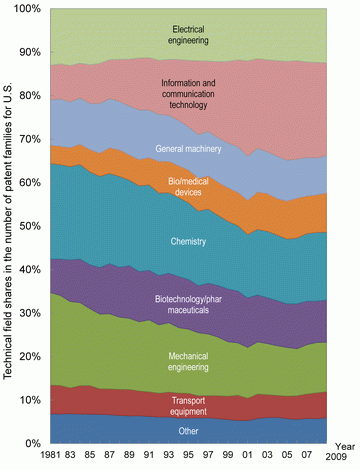
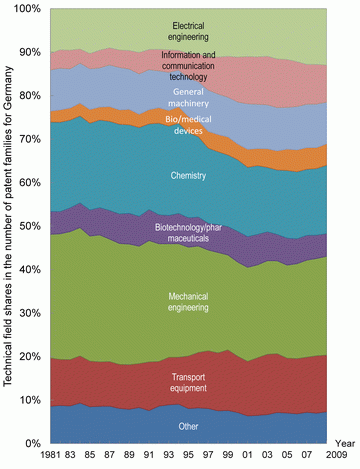
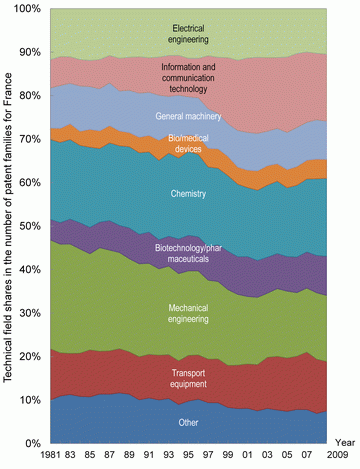
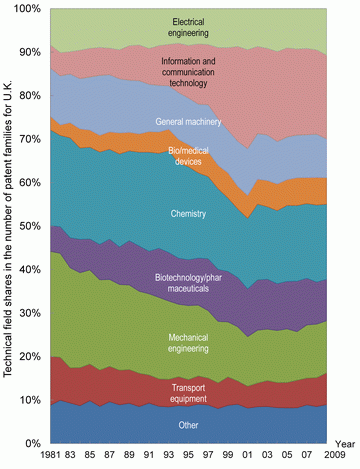
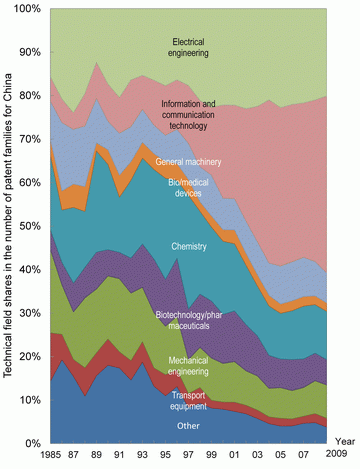
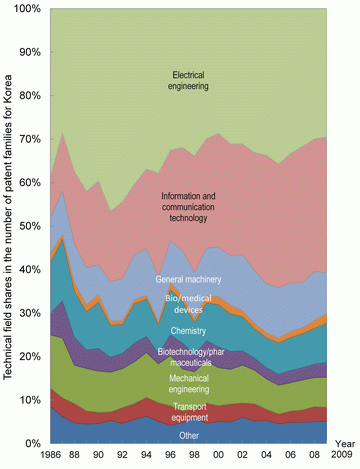
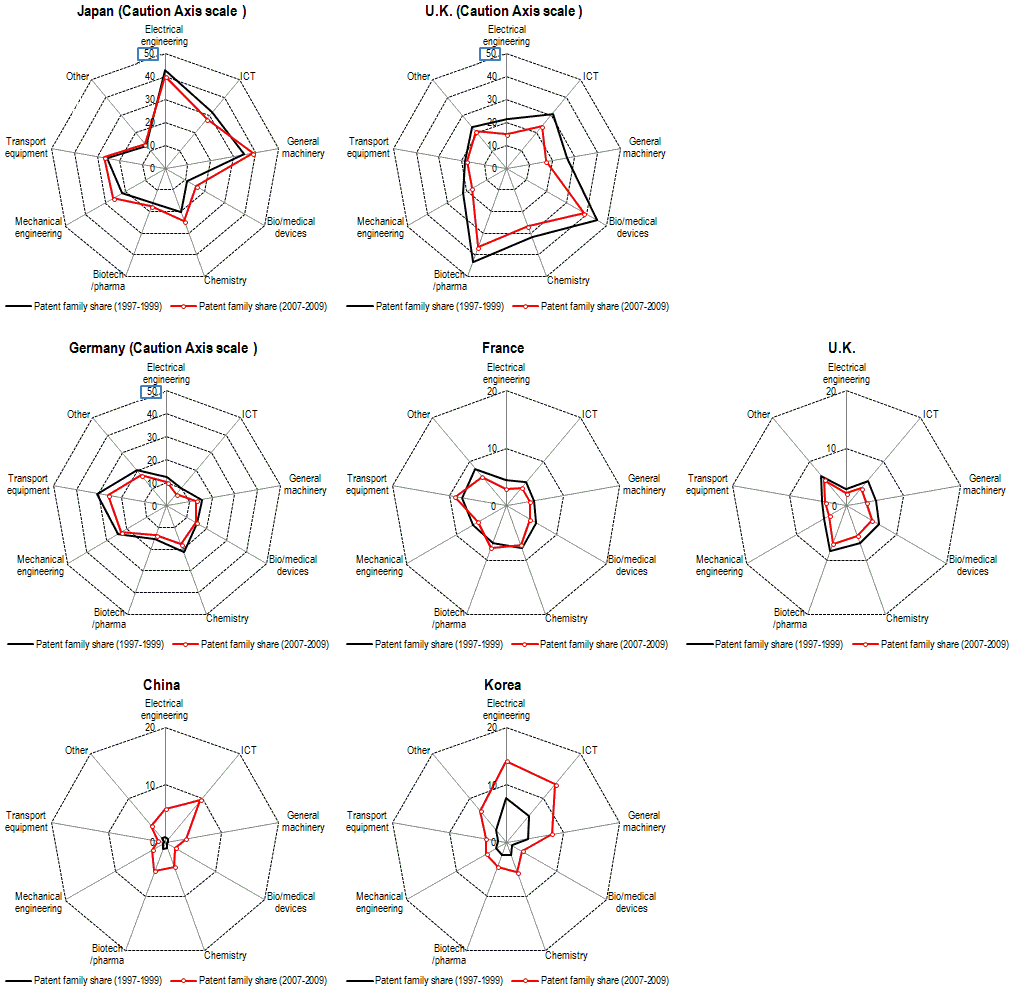
Next, Chart 4-2-9 shows changes in the technology field balances of the selected countries.
Looking at Japan's technology field balance as of 2009, Japan has high ratios in electrical engineering and general machinery in international comparison. A comparison of 1981 and 2009 figures for Japan shows that the share of electrical engineering increased by 7.8 percentage points. The share of information and communication technology also rose by 10.6 percentage points; however, its share among all technology fields was roughly the same as the field's international share. On the other hand, Japan has lower ratios in biotechnology/pharmaceuticals and bio/medical devices in terms of international comparison.
The U.S. has large shares for bio/medical devices, biotechnology/pharmaceuticals, and chemistry in international comparison. A comparison of 1981 and 2009 shows that bio/medical devices increased by 4.8 percentage points and chemistry biotechnology/pharmaceuticals increased by 2.0 percentage points. Its shares of electrical engineering and general machinery are small in international comparison.
Germany has large shares for transport equipment, mechanical engineering, and chemistry in international comparison. A comparison of 1981 and 2009 shows that transport equipment increased by 1.9 percentage points while mechanical engineering decreased by 5.7 points and chemistry decreased by 4.8 points. Although information and communication technology increased by 4.7 percentage points, the share of this field in Germany is roughly half of the international share of information and communication technology (as of 2009).
France has high shares of transport equipment, biotechnology/pharmaceuticals, and chemicals in international comparison. A comparison of 1981 and 2009 shows that biotechnology/pharmaceuticals increased by 4.3 percentage points. On the other hand, mechanical engineering showed a decrease of 9.8 percentage points. Although information and communication technology increased by 8.9 percentage points, like Germany, France's share is small compared to the international share of information and communication technology.
The U.K. has high shares for biotechnology/pharmaceuticals, chemistry, and bio/medical devices in international comparison. A comparison of 1981 and 2009 shows that biotechnology/pharmaceuticals increased by 3.6 percentage points and bio/medical devices increased by 3.0 points. Mechanical engineering decreased by 12.1 percentage points, chemistry by 4.7 points, and transport equipment by 3.9 points. The share of information and communication technology grew significantly by 13.9 percentage points and is roughly comparable with the international share of the field. Among the European countries, the U.K. has a high share for information and communication technology in its number of patent families.
China and Korea both have shares for information and communication technology and electrical engineering that rank high when compared to the international averages.
Note:
See the Technical Notes for details concerning the method used for patent family analysis.
Source:
Aggregated by NISTEP based on PATSTAT (October 2013 version) of the European Patent Office
(3) Technology field balances of the selected countries in the world
Chart 4-2-10 shows the technology field balances of the selected countries in the world. Specifically, it shows and compares the share of each technology field in the number of patent families of the selected countries (1997 to 1999 and 2007 to 2009; whole counting).
Japan has a portfolio with high shares for electrical engineering, general machinery, and information and communication technology and low shares for biotechnology/pharmaceuticals and bio/medical devices. A comparison of 1981 and 2009 in Chart 4-2-9 suggests that the share of information and communication technology is growing in Japan's domestic patent family. However, Japan's share in the world decreased from 31.6% to 28.1%. This is because China and Korea are rapidly increasing their international shares.
Looking at shares in the number of patent families from 2007 to 2009, the U.S. had international shares exceeding 25% in bio/medical devices, biotechnology/pharmaceuticals, chemicals. Germany had international shares exceeding 15% in transport equipment, mechanical engineering, chemistry, and other. France had international shares exceeding 7% in transport equipment, biotechnology/pharmaceuticals, and chemistry. A comparison of these countries with 1997-1999 shows that international shares are decreasing gradually or flat in many technology fields.
China and Korea are rapidly expanding their international shares. Korea, in particular, had international shares exceeding 10% in electrical engineering and information and communication technologies as of 2007-2009.
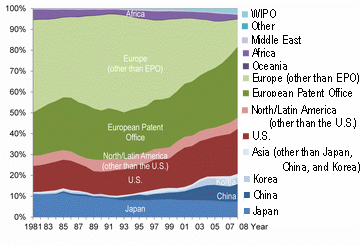
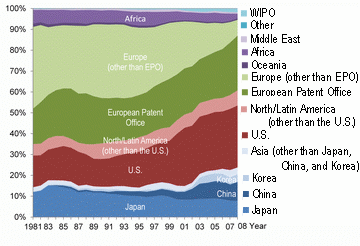
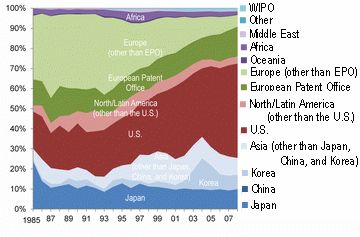
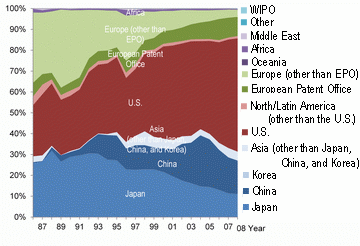
4.2.5 Destinations of patent family applications
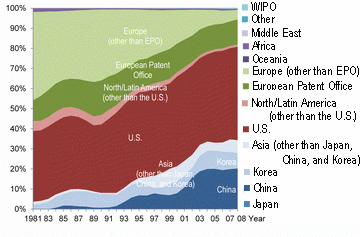
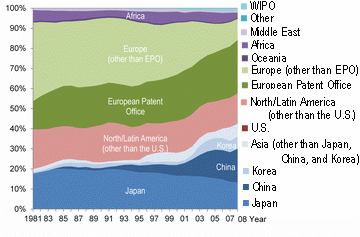
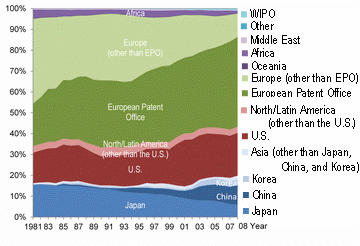
Next, the analysis looked at time-series changes in the international expansion of patent applications from the selected countries by examining the destinations of patent family applications (excluding those to own country) (Chart 4-2-11).
Looking at Japan, approximately 90% of its patent family applications went to the U.S. or Europe as of 1981; however, its applications to China have been increasing since the 1990s. As of 2008, applications to the U.S. accounted for 47%, those to China accounted for 20%, and those to the European Patent Office accounted for 13%. As for direct applications to the patent offices of individual European countries, this share has been shrinking year by year and accounted for 5% in 2008.
Looking at the U.S., as of 1981, approximately half of all patent family applications went to Europe, 20% went to North and Latin American countries other than the U.S., and 18% went to Japan. U.S. applications to Asian countries other than Japan has been increasing since the early 1990s. As of 2008, 43% of U.S. applications went to Asian countries. A certain number of applications also went to Africa.
Looking at Germany in 2008, 20% of its applications went to Asia, 24% to North and Latin America (including the U.S.), and 43% to the European Patent Office. In France, 21% of its applications went to Asia, 22% went to the U.S., and 34% went to the European Patent Office. And in the U.K., 24% went to Asia, 30% to the U.S., and 26% to the European Patent Office.
Looking at these countries in terms of their application destinations within Asia, Japan's percentage has fallen relatively while those of China and Korea have risen. As with the U.S., a certain number of applications also went to Africa.
Looking at applications from China, in the second half of the 1980s, approximately half went to Europe; following were Asia and the U.S. Subsequently, the share of applications to the U.S. has increased significantly while that to Europe has shrunk. As of 2008, 47% of applications went to the U.S., 25% to Asia, and 15% to the European Patent Office. As for Korea, in the second half of the 1980s, roughly one-third went each to the U.S., Europe, and Asia (principally Japan). Subsequently, the share of applications to the U.S. has been rising substantially. As of 2008, 54% went to the U.S. and 31% to Asia. Looking at application destinations in Asia, Japan's percentage is falling relatively while that of China is rising.
Note:
See the Technical Notes for details concerning the method used for patent family analysis.
Source:
Aggregated by NISTEP based on PATSTAT (October 2013 version) of the European Patent Office
Note:
See the Technical Notes for details concerning the method used for patent family analysis.
Source:
Aggregated by NISTEP based on PATSTAT (October 2013 version) of the European Patent Office
Technical Notes: Patent family analysis
For the Japanese Science and Technology Indicators 2014, NISTEP conducted an analysis based on patent families. This approach is intended to improve the potential for international comparison of patent application numbers.
“Patent families” refers to groups of patent applications that are made to two or more countries that are tied directly or indirectly by priority rights. Ordinarily, patents for which applications with the same content are made to multiple countries belong to the same patent family. Accordingly, counting patent families makes it possible to prevent double counting of the same patent. Additionally, counting patent families makes it possible to make a collective count of applications to patent offices around the world, rather than just applications to specific countries.
However, the results of patent family analysis are dependent upon the database used, way of defining “patent family,” and method of counting patent families.
Given this, the following summarizes the method used to analyze patent families for Japanese Science and Technology Indicators 2014 for consideration when making comparisons with other analyses. It should be noted that references to “tlsXXX” in the explanation are names of tables included in PATSTAT.
A) Database used in analysis
The European Patent Office's PATSTAT (October 2013 version) was used. PATSTAT contains statistical data on over 78 million patents in more 80 countries of the world.
B) Definition of “patent family”
Although various definitions of “patent family” exist, the DOCDB patent family (tls218_docdb_fam) prepared by the European Patent Office was used in the analysis appearing in Japanese Science and Technology Indicators 2014.
C) Counting of patent families
When counting patent families, the earliest application date among applications comprising the family and inventor's country of residence were used in conformity with the OECD Patent Statistics Manual. Whole counting on a country basis was used.
D) Method for acquiring inventors’ data
Given that there are many deficiencies in the inventors’ data and applicants’ data of PATSTAT, each patent family and country were associated as follows: Inventors' data and applicants' data were acquired using tls206_person、tls207_pers_appln、tls227_pers_publn.
[1] A search for all patent applications comprising a patent family was conducted, and results containing information on the inventor's country of residence were used.
[2] When results did not include information on the inventor's country of residence, a search for all patent applications comprising a patent family was conducted, and results containing information on the applicant's country of residence were used.
[3] When an association with a country could not be achieved in the above-mentioned process, information on the destination of the earliest application was used based on the assumption that the initial application is made in the applicant's country of residence.
E) Identification of patent families
Of the DOCDB patent families, applications submitted to a single patent-receiving office were considered single-country patents and those for which applications were sent to two or more patent-receiving offices were considered patent families.
F) Classification of technology field
The IPC-Technology Concordance Table ([http://www.wipo.int/ipstats/en/statistics/technology_concordance.html) (January 2013) issued by WIPO was used for classification of technology field using the International Patent Classification (IPC).
When multiple technology field were applicable to a single patent application, each field was calculated based on fractional counting.
G) Most recent available year for patent families
A patent family was counted only when applications were made to at least two countries. There are cases when a time lag of up to 30 months exists until the time that a patent application submitted as an international PCT application is handled domestically. Accordingly, 2009 was set as the most recent year that would allow analysis of a stable number of patent families. It should be noted that 2008 was set as the most recent available year for analysis of application destinations. For patent families + single-country applications, 2010 was set as the most recent available year.
H) Other important points
• Regarding applications having information recorded in PATSTAT (i.e., a record exists in tls201_appln) but which have not been published in official bulletins, etc. (i.e., there is no applicable record in tls211_pat_publn), such applications were considered to have been dropped and are therefore excluded from analysis.
• Regarding data on applications to the Australian patent office, aggregated values were considered to be abnormal values and therefore excluded from analysis.
• Short-term patents and design patents and plant patents of the U.S. were excluded from analysis.
Column: R&D trends by business enterprise size and business category when viewed from the standpoint of patent applications
- Deepening patent analysis using NISTEP's enterprise name dictionary -
As part of efforts to establish data infrastructure within the “Science of Science, Technology, and Innovation Policy” promotion project of the Ministry of Education, Culture, Sports, Science and Technology (MEXT), the National Institute of Science and Technology Policy (hereafter abbreviated as NISTEP) posts the “NISTEP enterprise name dictionary” (hereafter abbreviated as “the dictionary” ) on its website.(1) It is expected that this dictionary will be useful in analysis and study of R&D and innovation in industrial sectors.
The dictionary is a database that covers a broad range of data on profit-making enterprises in Japan (hereafter abbreviated as “enterprises” ), including histories of their name changes and mergers as well as their locations, latitude and longitude, corporate scale, and industrial classification. It can be used by connecting to other databases, including those for patents, financial affairs, and business surveys.
A connecting table with the IIP Patent Database (2) is made available for connection with patent data. Using this table makes it easier to conduct analyses on the following types of patent applications by enterprises.
Although the IIP Patent Database is prepared based on standardized data of the Japan Patent Office (3) , there are numerous notations that differ even among identical applicants (i.e., there is notation inconsistency). “Name-based aggregation” that corrects notation inconsistency and, further, discerns identity to prevent mis-recognition of enterprises having the same name but belonging to different industries and considers enterprise histories (such as past name changes and mergers) is required for connection to the dictionary. NISTEP has undertaken this steady work and is preparing connecting data.
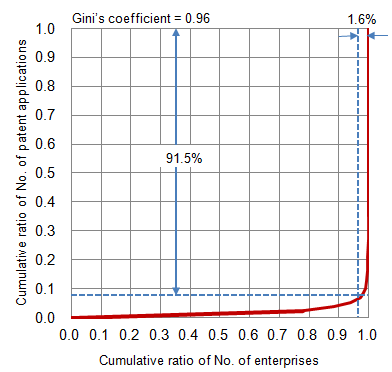
Chart 4-2-12 arranges enterprises' patent application numbers since 1970 in order from the smallest. The cumulative ratios of the number of enterprises is represented by the horizontal axis, and the cumulative ratios of the number of applications is represented by a Lorenz curve drawn along the vertical axis. As is demonstrated by the Gini's coefficient of 0.96, there is a large deviation in patent applications by enterprises. The patents of enterprises that have made at least 100 applications in the past (3,134 companies), which account for no more than 1.6% of all enterprises that have made applications, make up more than 90% of all patents applied for by enterprises.
(Lorenz curve)
Sources:
Japan Patent Office, “IIP Patent Database (version of March 31, 2011)”
National Institute of Science and Technology Policy, “NISTEP enterprise name dictionary”
(1) Enterprises that have submitted 100 or more applications in the past
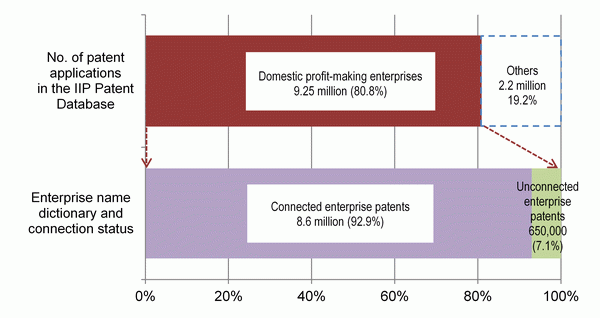
The dictionary contains data on 5,616 companies (7,430 companies when name changes are included (4) ). It also includes the above-mentioned enterprises that have submitted at least 100 applications in the past. Patent application data on 11.45 million applications from 1970 and thereafter are contained in the IPP Patent Database (version of March 31, 2011). As is shown in Chart 4-2-13, of these, 9.25 million applications (80.8%) are patents for which the applicant was in an enterprise. The dictionary is connected with 8.6 million of these (92.9% of patents applied for by enterprises).
Source:
Same as for Chart 4-2-12.
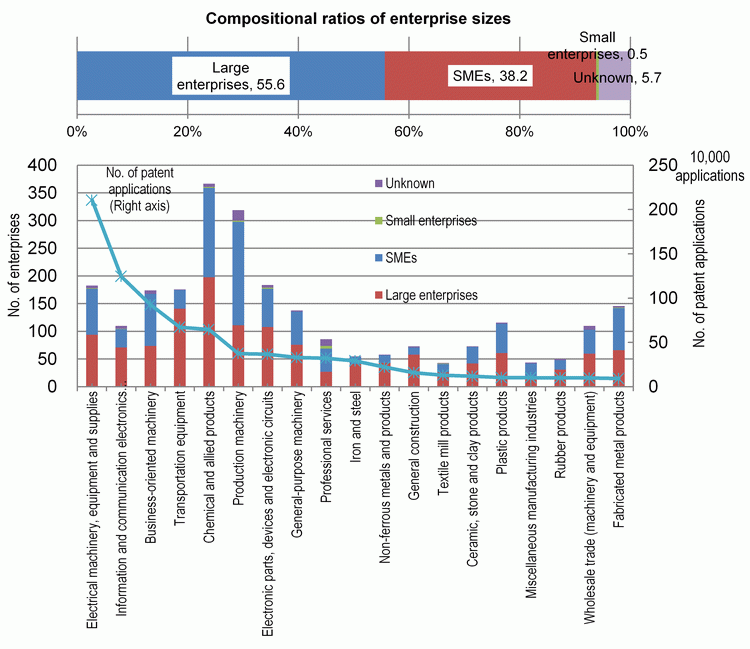
Focusing on companies that have submitted at least 100 patent applications in the past, Chart 4-2-14 provides a composition ratio by enterprise size and numbers of companies and numbers of patent applications by industry. Looking at the composition ratio at the top, it is understood that the ratio is not made up only of large enterprises, as SMEs also have a roughly 40% share. The industry having a high share in the compositional ratio among these SMEs is manufacture of production machinery, with accounts for more than 60%. While manufacture of chemical and allied products also has a large share among SMEs, many large enterprises are also involved in this sector, and thus SMEs have a ratio of only 40%. A look at the numbers of patent applications by industry on the bottom shows that electronics and information-affiliated enterprises stand out; however, a change in this situation has become evident in recent years (see Chart 4-2-15).
in the past and numbers of patent applications
Notes:
1) Classification of enterprise sizes is based on the Small and Medium Enterprises Basic Act.
2) “Unknown” refers to enterprises that no longer exist due to bankruptcy, liquidation, etc. Size-specific data could not be obtained for such enterprises.
Source:
Same as for Chart 4-2-12.
(2) Listed companies
In recent years, a large number of enterprises have moved from being business companies to holdings companies. In calculation of the number of applications based on the Japan Standard Industry Classification, these enterprises are calculated in industrial sectors that are apart from their main business. Given this, the author conducts the following analysis focused on listed companies using industrial sector data of the Securities Identification Code Committee provided in the dictionary.
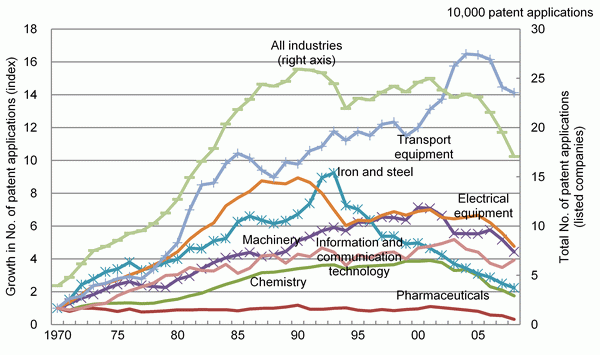
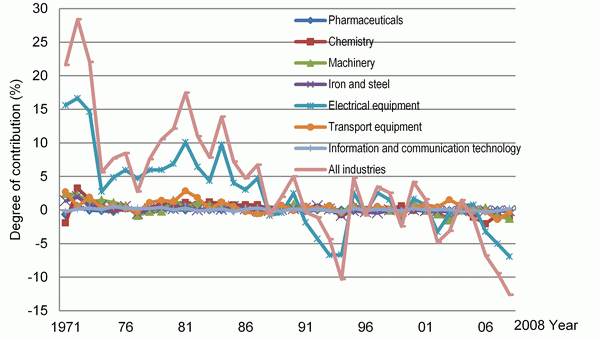
Chart 4-2-15 (A) shows year-by-year growth of the number of applications in each industrial sector based on the number for 1970, with focus on listed companies (3,544 companies) as of the end of January 2013. Electronic devices entered a downward trend after peaking in 1990, and has remained largely unchanged since 1994. Iron and steel has been declining consistently after peaking in the mid-1990s. Conversely, transport equipment has shown conspicuous growth. Although this growth stalled out following the collapse of the “bubble economy,” it accelerated again during the deflationary period of the 2000s. On the other hand, pharmaceuticals has shown absolutely no growth up to the present day. It deserves noting, however, that this sector includes seven young companies that were established in 2000 or later, and that many of these enterprises are so-called “drug-discovery ventures.”
Chart 4-2-15 (B) shows the degree to which year-on-year changes in the number of applications for certain industrial sectors contribute to changes in the total number of applications by all enterprises. The degree of contribution of an industrial sector is expressed as ΔPi/P×100, with P representing the total number of applications by all enterprises in the previous year. The total of the degrees of contribution for all sectors matches growth in the number of applications by all enterprises.
Notes:
1) Data for 2009 and thereafter are not presented due to circumstances of the records of applied patents in the IIP Patent Database (version of March 31, 2011).
2) Only main industrial sectors are presented.
Source:
Same as for Chart 4-2-12.
Even though the number of applications in electronic devices peaked in the mid-1990s, this sector continues to make a significant contribution to growth (including negative growth) of the number of applications for all listed companies. Looking at other sectors, while transport equipment shows a small degree of influence, the contributions of the other sectors are consistently within a range of plus or minus 3%.
A number of factors are assumed to be behind the fall in the number of patent applications in electronic devices, among them are decreased R&D expenditure, smaller numbers of inventors due to the maturation of business and technologies, and the dispersal of applications to other sectors as a result of the splitting up of companies into different business areas (semiconductors, software business, etc.). This will be topic of future analysis.
(Yasuo Nakayama)
Column: A look at university-initiated patents
Each year, MEXT's University Technology Transfer Promotion Office issues a document titled “the state of industry-academia collaboration in universities.” This document presents the aggregate results of a MEXT survey on the state of industry-academia collaboration in universities throughout Japan. It is thought to cover nearly 100% of official data on joint research, contracted research, the number of patent applications, and the number of licenses granted and resulting revenue.
However, detailed analyses on the quality of university-initiated patents cannot be conducted based on this document alone. Given this, the author independently extracted university-initiated patents from a patent database (IIP Patent Database) and combined a number of indicators to compare the quality of university-initiated patents and patents of private enterprises. It should be noted that “university-initiated patent” as it is used here refers to a patent in which the name or address of the applicant contains a character string representing the name of a university, the name of a school corporation, or the name of an approved TLO, or in which the address of the inventor includes a character string representing the name of a university in Japan. Given this, there is no clear picture of patents for which a university researcher provides his or her name as the inventor and records his or her private address on the form, and the applicant is a private enterprise. (It is known that a considerable number of such patent applications were made during the 1980s and 1990s). Additionally, “patents of private enterprise” as it is used here refers to a patent in which the name of the applicant contains kabushiki kaisha or (kabu) (joint stock company), yugen geisha or (yu) (limited company), goshi gaisha (limited partnership), gijutsu kenkyu kumiai (technical research association), kyokai (association), kyodo (association) or other such character string.
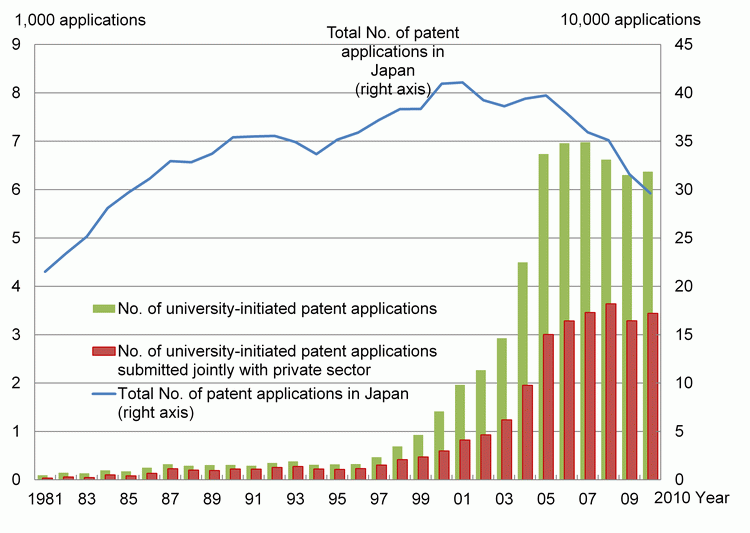
As is shown in Chart 4-2-16, university-initiated patents began to increase rapidly from around 1998, when the Technology Licensing Organization Act was enacted. From 2005, the year after national universities attained corporation status, the number has fluctuated in the 6,000 to 7,000 range each year. The numbers of applications from 2004 roughly match with the above-mentioned aggregated data announced by MEXT, and no major data omissions are thought to exist. However, a point that deserves attention here is the fact that approximately half of university-initiated patents were applied for jointly with private enterprises. So then, how do joint applications with the private sector influence the quality of university-initiated patents? And how does the quality of university-initiated patents that were applied for in large numbers during the 2000s differ from that of patents applied for before then?
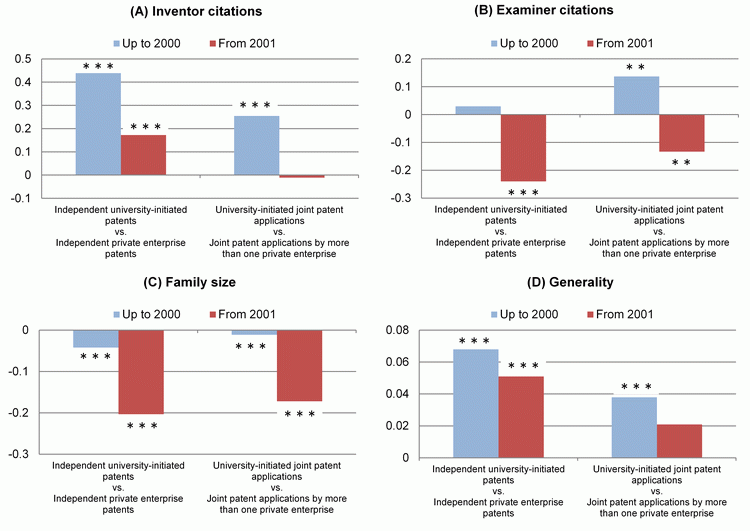
It is known that the “quality” of patents has various aspects. Given this, the author used the following four indicators:
Inventor citations: Number of citations made by inventors of subsequent patents (five-year total)
Examiner citations: Number of citations made by patent examiners when denying subsequent patents (five-year total)
Family size: Geographical scope of the patent (Number of countries of application)
Generality: Technological scope of the patent (Concentration of technology classes covered by citing patents)
Chart 4-2-17 shows the result of a regression analysis of these indicators (see the source literature (5) for details on the data and analysis results).
As a result, it was found that the quality of university-initiated patents up to 2000 had comparatively high values for almost all of the indicators when compared with private-sector patents. (Although university-initiated patents had a lower value than private-sector patents for family size [minus sign on the coefficient], this is likely to be more due to financial limitations of the university and its representative application body than a deficiency in quality.)
In particular, university-initiated patents had significantly high scores in terms of inventor citations, which are thought to represent quality as “technical knowledge,” and generality, which is thought to be represent “knowledge spillover.” Additionally, while examiner officer citations tend to be more representative of business value (in the sense that such citations block subsequent competing patents) than quality as technical knowledge, it is apparent looking at the results that joint university-initiated patents had a higher value compared to private-sector patents, even when patents up to 2000 are viewed.
On the other hand, however, a problem is the quality of patents from 2001 and thereafter. The quality of university-initiated patents falls relatively significantly for all indicators beginning in 2001. Up to examiner officer citations, both independent patents and joint patents of universities have low values compared to private-sector patents (minus sign on the coefficient).
What the results of the above analysis suggest is that fairly low-quality patents were produced in large volumes as a result of a series of institutional changes, including TLO establishment and national universities' acquirement of corporation status. When viewed from the standpoint of partner enterprises, patents that are applied for jointly with private enterprises are seen to raise the appropriability of joint research achievements and help realize innovation. The fact that the examiner officer citations value is higher for joint patents than independent university patents is likely a reflection of this.
However, at the same time, if it is considered that overall quality has been decreasing since the 2000s, then it becomes unclear whether or not the effects of the series of institutional reforms that should be measured in combination of “quantity and quality” are positive. Additionally, if the role that universities play as sources of public knowledge is considered, then it becomes apparent that the time is coming when a rethink of universities' patent policies will be necessary.
(Jun Suzuki)
Note:
The definition of “private sector” includes appearance of the following character strings in the applicant's name:  (kabushiki kaisha),
  (kabu),
  (gijutsu kenkyu kumiai),
  (yugen gaisha),
  (yu),
(yu),  (goshi gaisha),
  (kyokai),
  (kyodo), and
  (kabushiki kaisha).
Source:
Aggregated by NISTEP based on the IIP Patent Database
Notes:
1) The regression analysis used the four indicators as explained variables; “university-initiated patents,” “joint patents,” and “up to 2001” as explanatory variables (dummy variables); and various control variables.
2) “University-initiated independent patents” are a comparison with “independent patents of private enterprises,” and “university-initiated joint patent applications” are a comparison with “joint patent applications by more than one private enterprise.” It should be noted that “university-initiated joint patent applications” refers to joint applications by a “university” and a “private enterprise.” Joint applications by two or more universities or with a national research institute were excluded from the analysis.
3) The vertical axis of each chart expresses total effect calculated from the coefficients of the dummy variables (including cross terms). Because the four indicators vary in terms of unit and estimate models and effective samples, no comparisons can be made between them. **indicates a 5% significance level; *** indicates a 1% significance level.
Source:
Aggregated by NISTEP based on the IIP Patent Database
(1) https://www.nistep.go.jp/research/scisip/rd-and-innovation-on-industry
(2) A database developed for patent statistics analysis based on sorted and standardized data of the Japan Patent Office that is made available by the Institute of Intellectual Property.
(3) Data that has been sorted and standardized into the SGML format or XML format for the supply of patent data.
(4) Numbers are from the version released as of May 2014. In the version planned for release in the next period, it is anticipated that the number including name changes will be approximately 15,000 companies.
(5) Suzuki, Tsukada and Goto,” Innovation and Public Research Institutes: -Cases of AIST, RIKEN, and JAXA-” , 2014, RIETI Discussion Paper Series 14-E-021

