
“Japanese Science and Technology Indicators” is a basic resource for systematically ascertaining Japan's S&T activities based on objective and quantitative data. It presents S&T activities in Japan using approximately 150 indicators by classifying such activities into categories; namely, “R&D expenditure,” “R&D personnel,” “higher education,” “the output of R&D,” and “science, technology and innovation.”
"Science and Technology Indicators 2014" presents indicators that have shown changes as well as indicators that deserve attention.
1. Circumstances in Japan and the selected countries in terms of R&D expenditure
(1) Japan's total R&D expenditure has remained mostly unchanged since 2009.
Looking at the total R&D expenditure of the selected countries as an indicator of the scale of Japan's R&D, in 2012 Japan's expenditure amounted to 17.3246 trillion yen (OECD estimate: 15.9 trillion yen), a figure that has remained mostly unchanged since 2009. Looking at the other countries, the U.S. has a much larger expenditure compared to the others. China's expenditure surpassed Japan's in 2009 and is continuing to grow.

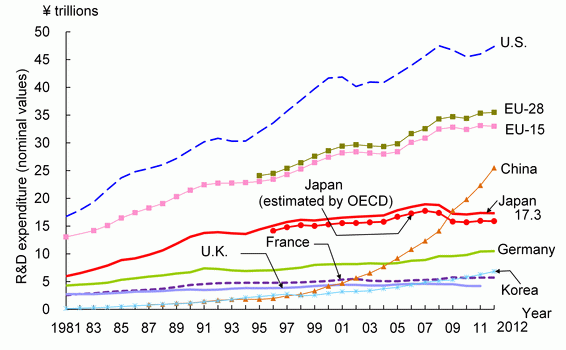
Reference: Main text chart 1-1-1 (A)
(2) Japan's business enterprises continue to emphasize R&D.
Looking at the general conditions of business enterprises, which account for approximately 70% of Japan's total R&D expenditure, the year-on-year R&D expenditure and sales growth rates of Japanese business enterprises show a roughly linked trend. In 2009, the year in which the global economic crisis (called the "Lehman Shock" in Japan) affected Japanese business enterprises, R&D expenditure and the year-on-year sales growth rate were on the negative side by a large margin. However, the ratio of R&D expenditure to sales, which is an indicator showing the degree of focus that business enterprises place on R&D, has remained at a high level since 2009. It is therefore thought that business enterprises are continuing to emphasize R&D.
in the Japanese business enterprise sector, and ratio of R&D expenditures to sales
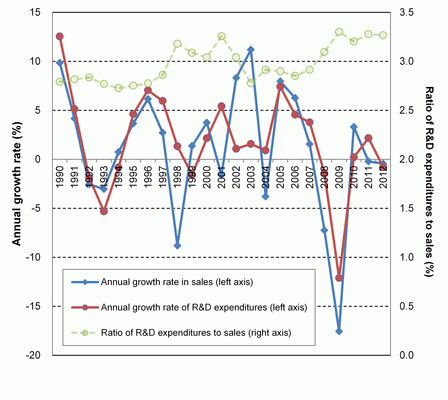
Reference: Main text chart 1-3-11
(3) Indirect support forms the major part of government support for R&D by Japanese business enterprises.
A look at "direct support" (amount of business enterprises' R&D expenditures borne by the government) and "indirect support" (amount of business enterprises' corporate taxes to be paid to the government that is exempted through R&D tax incentives) on a ratio to GDP basis in order to view government support for business enterprises' R&D shows that the share of indirect support is larger in Japan. Looking at other countries, those in which direct government support to business enterprises is large include Russia, Slovenia and the U.S. Countries in which indirect support is large include France, Canada, and Belgium.
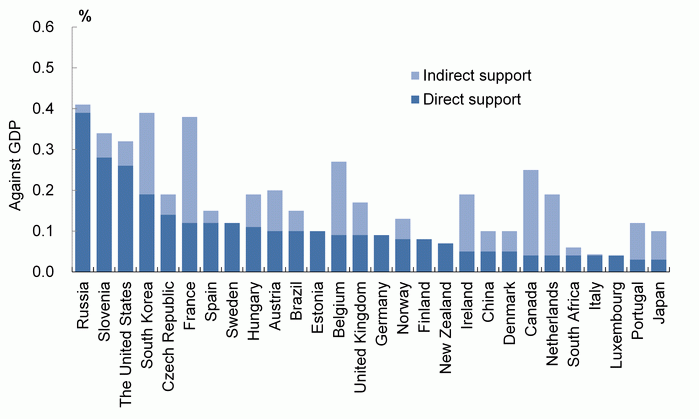
Reference: Main text chart 1-3-8 (A)
2. The situations in Japan and the selected countries in terms of R&D personnel
(1) Japan ranks third behind China and the U.S. in the number of researchers.
Looking at the numbers of researchers in the selected countries, in 2013, Japan had 660,000 researchers in terms of FTE value (full-time equivalent) and 890,000 in terms of HC value (actual value). A comparison of FTE values shows that Japan ranks third behind China and the U.S. It should be noted that Japan's numbers have remained roughly the same since the second half of the 2000s.


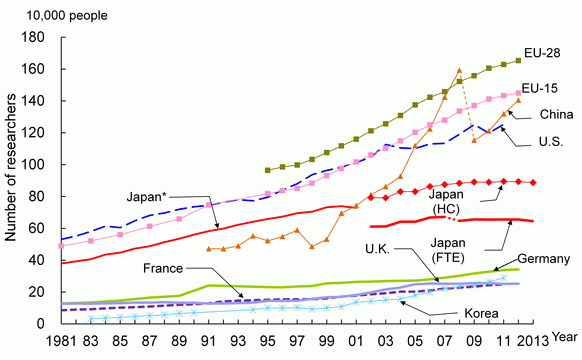
Note: FTE: Full-time equivalents; (number converted for full-time research activity) HC: head count (actual number)
Reference: Main text chart 2-1-3
(2) The ratio of female researchers in Japan is large in the "universities and colleges" sector but low in the "business enterprises" sector.
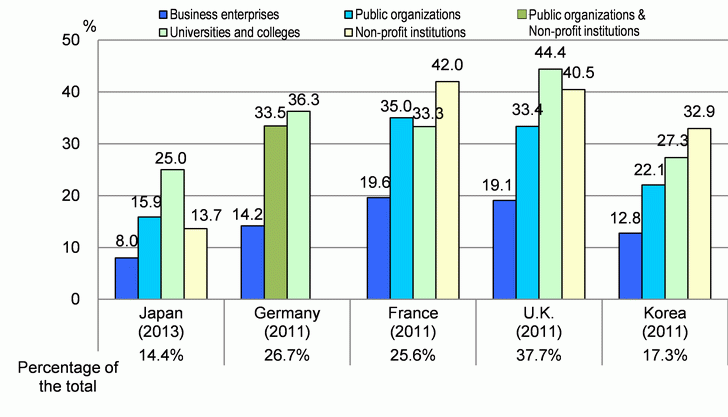
Looking at female researchers in the selected countries by sector, in each country, the ratio of female researchers was smallest in the business enterprises sector. The ratio was relatively large in the universities and colleges sector in each country.
In the case of Japan, the share of female researchers in the universities and colleges sector was large at 25.0%. On the other hand, the share of female researchers in the business enterprises sector was smallest, accounting for 8.0% of the total. Additionally, Japan's share of female researches in the non-profit institutions sector is small compared to the selected countries.
Reference: Main text chart 2-1-13
3. The situation in Japan in terms of university and graduate students
(1) The number of female students enrolling in Japanese universities is growing.
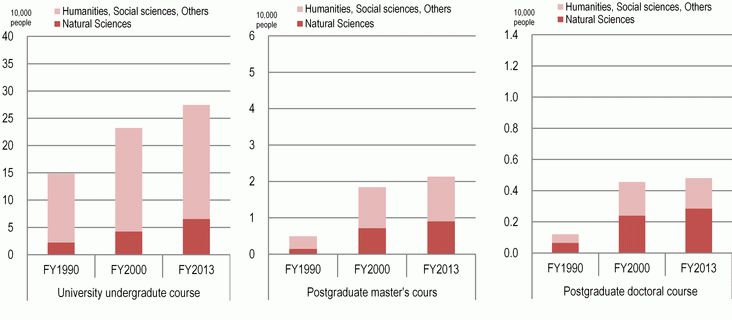
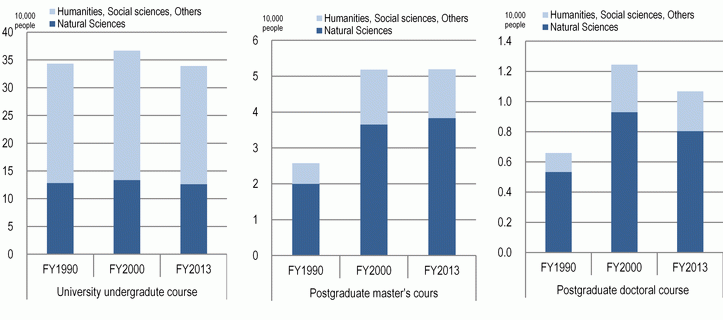
Looking at the numbers of students enrolling in Japan's undergraduate departments, master's programs, and doctoral programs, the number of enrolling female students is increasing. On the other hand, the number of enrolling male students is decreasing.
Looking at the numbers of newly enrolled students in Japan's universities and graduate schools, that for doctoral courses began decreasing in 2003 and that for master's programs began decreasing after peaking in 2010, while that for undergraduate departments has remained flat since around 2000. Thus, human resources development in institutions of higher education is improving from the standpoint of diversity due to increasing numbers of female enrollees. However, it is also shrinking in size when viewed in terms of the total number of enrolling students. This situation may have an impact on the supply of R&D personnel and advanced human resources in the future.
master's programs, and doctoral programs
Reference: Main text chart 3-2-6
(2) The number of Chinese graduate school students among foreign graduate students in Japan is extremely high.
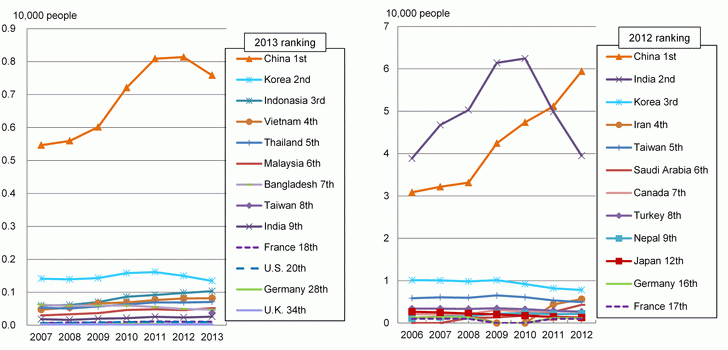
Looking at the state of foreign graduate students in Japan and the U.S., Japan had 16,000 foreign graduate students in the natural sciences field (2013). Chinese graduate students accounted for the largest share of this number with 8,000, which was half the total. On the other hand, in the U.S. had 163,000 foreign graduate students in the science and engineering field (2012). Chinese and Indian graduate students had the largest shares of this number, accounting for a combined total of 60%.
Reference: Main text chart 3-5-1
4. Circumstances in Japan and the selected countries in terms of R&D output
(1) Japan continues to have a declining presence in terms of its share of the number of papers published.
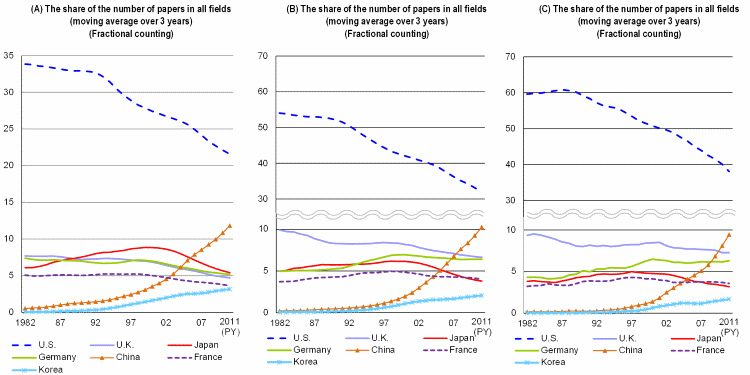
The following looks at papers published, which is a measure of R&D output. Looking first at share of the number of papers, between the 1980s and the early 2000s, Japan's share grew to surpass those of the U.K. and Germany, and for a while ranked number two in the world; however, its share has been declining in recent years. However, this tendency toward a declining share is not limited to Japan, as it is also seen for the U.K., Germany, and France.
Moreover, looking at shares of the numbers of adjusted top 10% papers and adjusted top 1% papers as qualitative indicators, Japan saw its shares increase gradually from the 1980s into to the early 2000s; however, these shares have been decreasing rapidly since then.
and number of adjusted top 1% papers of the selected countries
(All fields, fractional counting, three-year moving average)
Reference: Main text chart 4-1-7
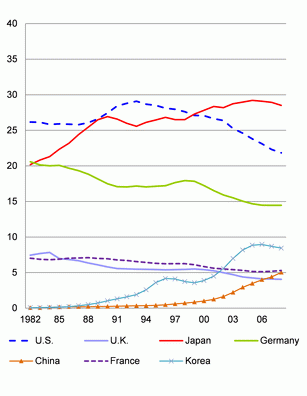
(2) Japan's ranked first in terms of share of patents (number of patent families) in 2000.
Next, looking at numbers of patent families, which are measured by the number of inventions produced by each country and region in an internationally comparable form, with particular attention to patents, Japan and the U.S. traded places during the second half of the 1990s before Japan took the top share in the 2000s. This reflects the fact that the number of patent applications submitted from Japan to multiple countries increased.
(All technical fields, whole counting, three-year moving average)
Reference: Main text chart 4-2-6 (B)
(3) Japan has high shares of the number of patents (number of patent families) in the electrical engineering, general machinery, and information and communication technology fields.
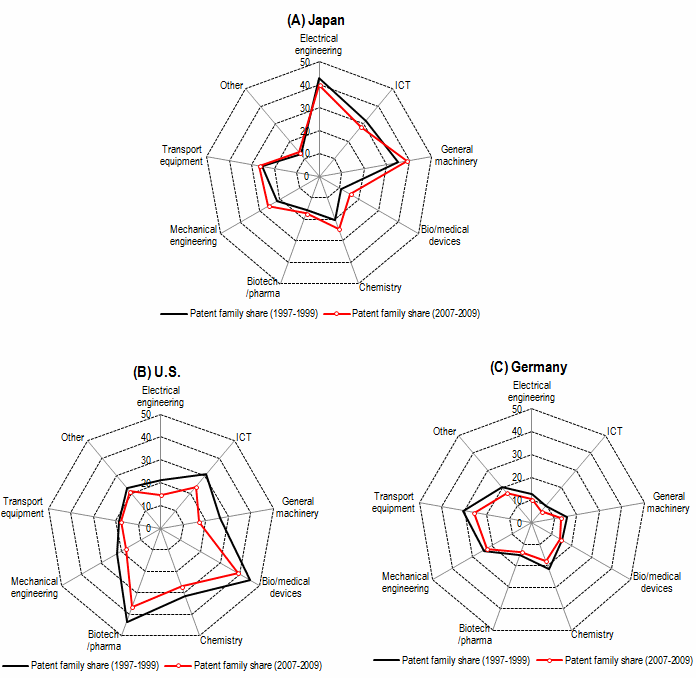
Looking at Japan's technology field balance among patent families, Japan has a portfolio with high shares for electrical engineering, general machinery, and information and communication technology and low shares for biotechnology/pharmaceuticals and bio/medical devices.
in the selected countries
(%, 1997-1999 and 2007-2009, whole counting)
Reference: Main text chart 4-2-10
5. Circumstances in Japan and the selected countries in terms of science, technology, and innovation
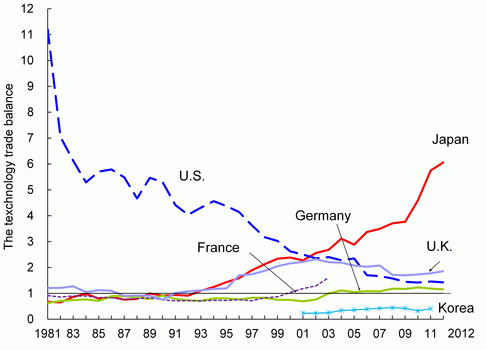
(1) Japan's technical strength is rising in the world in terms of its technology trade balance.
Looking at technology trade, which illustrates international trade of technical knowledge as an indicator of each country's technical strength, Japan's technology trade balance has been rising continuously since surpassing 1 in 1993. In 2012, it reached a high level of 6.1. This is primarily due to a decline in technology imports, most noteworthy of which is a decline in imports from the U.S. Looking at technology trade exclusive of that between parent companies and subsidiaries, Japan's technical trade balance in 2012 was 2.0. It has had an export surplus since 2006. On the other hand, the U.S.'s technical trade balance was 4.0 (reference: main text chart 5-1-2 B).
Reference: Main text chart 5-1-1 (B)
(2) Japan's superior competitiveness in high-technology industries is eroding; however, it maintains high competitiveness in medium-high technology industries.
Looking at high-technology industrial competitiveness from the standpoint of products and services trade balance, Japan's balance ratio was 0.9 in 2012, a figure that fell below 1 and marked Japan's first import surplus. This is primarily due to an increase in technology imports, most noteworthy of which is an increase in imports from radio, television, and communication equipment industries.
On the other hand, Japan's industry trade balance ratio in medium high-technology industries was 3.0 in 2013. This ranked number one among the selected countries. Japan showed a rapid decline in the mid-1990s followed by a gradual decrease; however, its export surplus is still larger than the other countries.
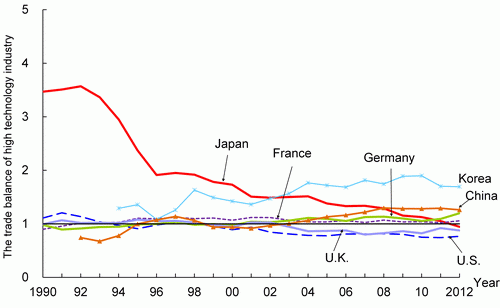
Reference: Main text chart 5-2-3
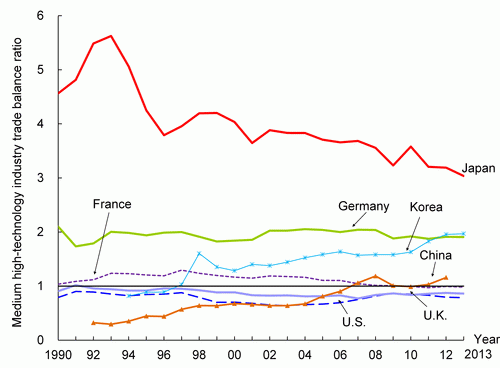
Reference: Main text chart 5-2-5
Note: High-technology industries: "Pharmaceuticals," "Radio, Television and Communication Equipment," and "Aircraft and Spacecraft"
Medium high-technology industries: “Chemicals (excluding Pharmaceuticals),” “Machinery & Equipment,” “Electrical Machinery and Apparatus (excluding Telecommunications Equipment),” “Motor Vehicles, Trailers and Semi-Trailers,” and “Railroad Equipment and Transport Equipment.”
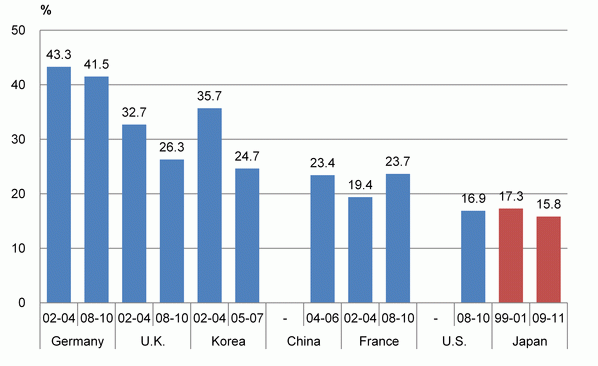
(3) Japan's share of companies that achieved process innovation is low compared to the selected countries but growing.
Looking at the shares of companies that achieved innovation of the selected countries in terms of product and process innovation, Japan's share of companies that achieved product innovation is low compared to the selected countries and decreasing. However, the shares of Germany, the U.K., and Korea are also decreasing. On the other hand, looking at shares of companies that achieved process innovation, Japan's share is low compared to the selected countries but only Japan's share is growing.
It should be noted that the shares of companies that achieved innovation that are presented here are the results of aggregation based on numbers of companies without consideration for company size. It is therefore thought that the circumstances of small and medium-size enterprises, which make up the majority of the number of companies, are more strongly expressed in the data.
(A) Shares of companies that achieved product innovation
(B) Shares of companies that achieved process innovation
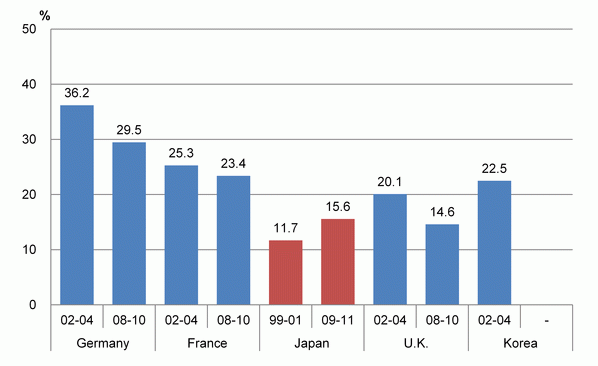
Reference: Main text chart 5-4-2 (A,), (B)
Characteristics of the Japanese Science and Technology Indicators
The Japanese Science and Technology Indicators is published each year to present the most recent values at the time of publication. It is a collection of items that allow time-series comparisons as well as comparisons among the selected countries based on data that are updated each year in principle.
- Use of statistical data announced by each country
Wherever possible, statistical data announced by each country are used as the sources of data for indicators appearing in Japanese Science and Technology Indicators. Every effort has been made to clarify each country's method of collecting statistics and how it differs from other countries’ methods. - Independent NISTEP analysis of paper and patent databases
Paper data were independently aggregated and analyzed by NISTEP using journal data in Thomson Reuters Web of Science. The aggregation method is provided and explained in detail.
Of indicators pertaining to patents, patent family data were independently aggregated and analyzed by NISTEP using journal data in PATSTAT (the patent database of the European Patent Office). The aggregation method is provided and explained in detail. - Presentation of topical indicators in “columns”
In addition to base indicators, those indicators having topicality or are expected to have particular importance in the future are presented in the form of “columns.” - Use of “reminder marks” for international comparisons and time-series comparisons
The reminder marks “attention to international comparison” and “attention to trend”
  have been attached to graphs where they are required. Generally, the data for each country conform to OECD manuals and other materials. However, differences in methods of collecting data or scope of focus do in fact exist, and therefore attention is necessary when making comparisons in some cases. Such cases are marked “attention to international comparison.” Likewise, for some time series data, data could not be continuously collected under the same conditions due to changes in statistical standards. Cases where special attention is required when reading trends of increases and decreases are marked “attention to trend.” Specifics for such points requiring attention are provided in the notes of individual charts.
- Downloading statistical data (numerical data of graphs provided in the report)
Numerical data of the graphs provided in the report can be downloaded from the following URL:
https://www.nistep.go.jp/sti_indicator/2014/RM229_table.html

